Scotch-Irish vs Immigrants from Cuba Unemployment Among Ages 30 to 34 years
COMPARE
Scotch-Irish
Immigrants from Cuba
Unemployment Among Ages 30 to 34 years
Unemployment Among Ages 30 to 34 years Comparison
Scotch-Irish
Immigrants from Cuba
5.7%
UNEMPLOYMENT AMONG AGES 30 TO 34 YEARS
8.6/ 100
METRIC RATING
212th/ 347
METRIC RANK
5.0%
UNEMPLOYMENT AMONG AGES 30 TO 34 YEARS
99.4/ 100
METRIC RATING
28th/ 347
METRIC RANK
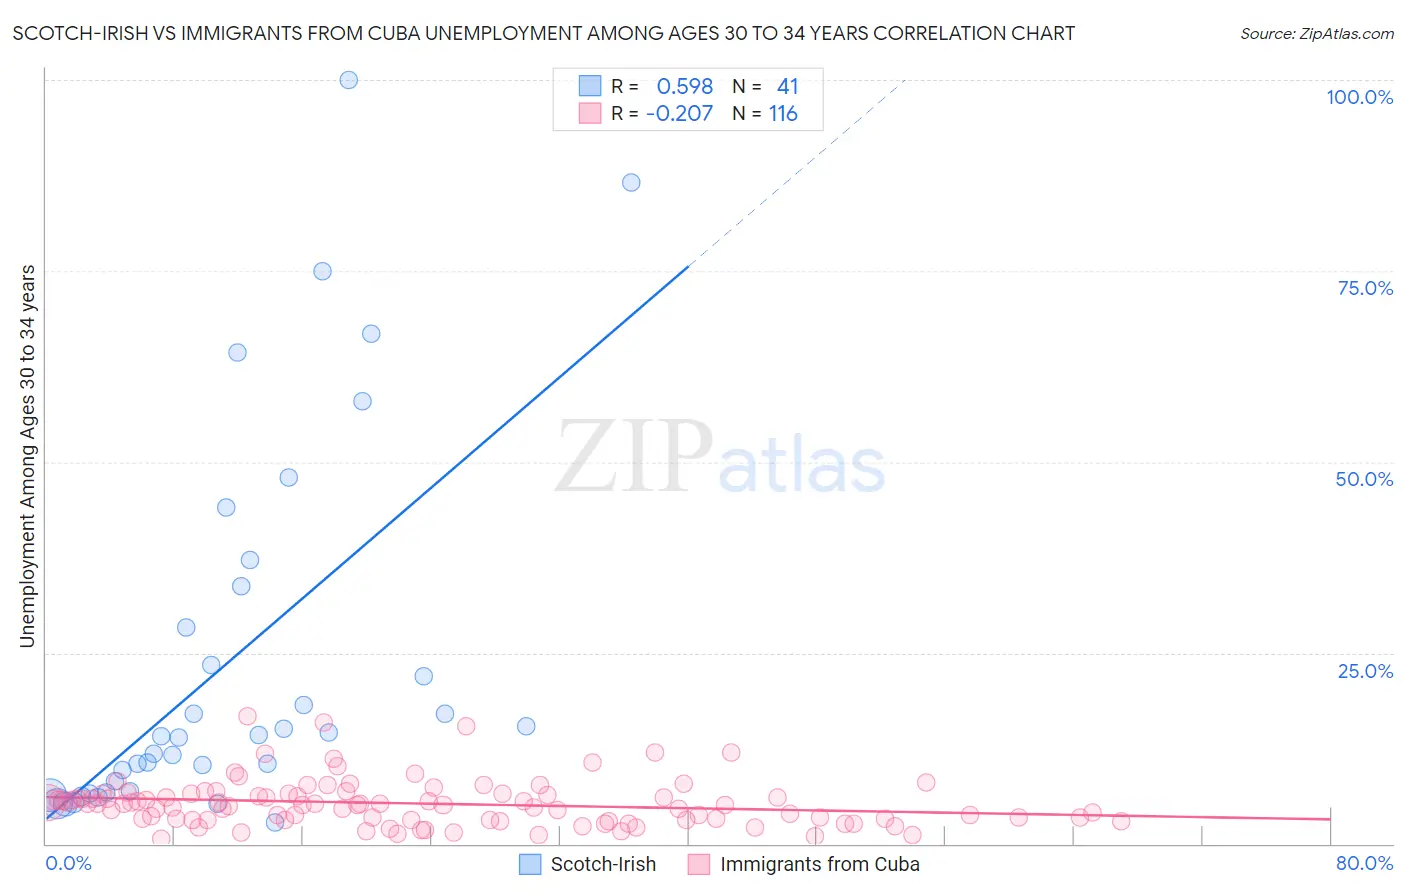
Scotch-Irish vs Immigrants from Cuba Unemployment Among Ages 30 to 34 years Correlation Chart
The statistical analysis conducted on geographies consisting of 482,054,046 people shows a substantial positive correlation between the proportion of Scotch-Irish and unemployment rate among population between the ages 30 and 34 in the United States with a correlation coefficient (R) of 0.598 and weighted average of 5.7%. Similarly, the statistical analysis conducted on geographies consisting of 311,360,342 people shows a weak negative correlation between the proportion of Immigrants from Cuba and unemployment rate among population between the ages 30 and 34 in the United States with a correlation coefficient (R) of -0.207 and weighted average of 5.0%, a difference of 14.2%.
Unemployment Among Ages 30 to 34 years Correlation Summary
| Measurement | Scotch-Irish | Immigrants from Cuba |
| Minimum | 2.8% | 0.70% |
| Maximum | 100.0% | 16.6% |
| Range | 97.2% | 15.9% |
| Mean | 23.7% | 5.3% |
| Median | 14.0% | 5.1% |
| Interquartile 25% (IQ1) | 6.8% | 3.1% |
| Interquartile 75% (IQ3) | 31.1% | 6.5% |
| Interquartile Range (IQR) | 24.3% | 3.3% |
| Standard Deviation (Sample) | 24.5% | 3.0% |
| Standard Deviation (Population) | 24.2% | 3.0% |
Similar Demographics by Unemployment Among Ages 30 to 34 years
Demographics Similar to Scotch-Irish by Unemployment Among Ages 30 to 34 years
In terms of unemployment among ages 30 to 34 years, the demographic groups most similar to Scotch-Irish are Spanish American Indian (5.7%, a difference of 0.010%), White/Caucasian (5.7%, a difference of 0.11%), Immigrants (5.7%, a difference of 0.35%), French (5.7%, a difference of 0.42%), and Immigrants from Philippines (5.7%, a difference of 0.54%).
| Demographics | Rating | Rank | Unemployment Among Ages 30 to 34 years |
| Immigrants | Costa Rica | 14.4 /100 | #205 | Poor 5.6% |
| Alsatians | 14.3 /100 | #206 | Poor 5.6% |
| Israelis | 12.8 /100 | #207 | Poor 5.6% |
| Immigrants | Philippines | 11.5 /100 | #208 | Poor 5.7% |
| French | 10.8 /100 | #209 | Poor 5.7% |
| Whites/Caucasians | 9.2 /100 | #210 | Tragic 5.7% |
| Spanish American Indians | 8.7 /100 | #211 | Tragic 5.7% |
| Scotch-Irish | 8.6 /100 | #212 | Tragic 5.7% |
| Immigrants | Immigrants | 7.1 /100 | #213 | Tragic 5.7% |
| Immigrants | Panama | 5.9 /100 | #214 | Tragic 5.7% |
| Immigrants | Cambodia | 5.8 /100 | #215 | Tragic 5.7% |
| Immigrants | Syria | 5.5 /100 | #216 | Tragic 5.7% |
| Immigrants | Fiji | 5.1 /100 | #217 | Tragic 5.7% |
| Panamanians | 4.5 /100 | #218 | Tragic 5.8% |
| French Canadians | 4.4 /100 | #219 | Tragic 5.8% |
Demographics Similar to Immigrants from Cuba by Unemployment Among Ages 30 to 34 years
In terms of unemployment among ages 30 to 34 years, the demographic groups most similar to Immigrants from Cuba are German Russian (5.0%, a difference of 0.020%), Norwegian (5.0%, a difference of 0.040%), Somali (5.0%, a difference of 0.13%), Immigrants from Zaire (5.0%, a difference of 0.18%), and Danish (5.0%, a difference of 0.24%).
| Demographics | Rating | Rank | Unemployment Among Ages 30 to 34 years |
| Ethiopians | 99.8 /100 | #21 | Exceptional 4.9% |
| Immigrants | South Central Asia | 99.8 /100 | #22 | Exceptional 4.9% |
| Hmong | 99.8 /100 | #23 | Exceptional 4.9% |
| Ugandans | 99.7 /100 | #24 | Exceptional 4.9% |
| Immigrants | Singapore | 99.5 /100 | #25 | Exceptional 5.0% |
| Immigrants | Kuwait | 99.5 /100 | #26 | Exceptional 5.0% |
| Danes | 99.5 /100 | #27 | Exceptional 5.0% |
| Immigrants | Cuba | 99.4 /100 | #28 | Exceptional 5.0% |
| German Russians | 99.4 /100 | #29 | Exceptional 5.0% |
| Norwegians | 99.4 /100 | #30 | Exceptional 5.0% |
| Somalis | 99.3 /100 | #31 | Exceptional 5.0% |
| Immigrants | Zaire | 99.3 /100 | #32 | Exceptional 5.0% |
| Immigrants | Saudi Arabia | 99.3 /100 | #33 | Exceptional 5.0% |
| Latvians | 99.3 /100 | #34 | Exceptional 5.0% |
| Immigrants | Ethiopia | 99.2 /100 | #35 | Exceptional 5.0% |