Scotch-Irish vs White/Caucasian Unemployment Among Ages 30 to 34 years
COMPARE
Scotch-Irish
White/Caucasian
Unemployment Among Ages 30 to 34 years
Unemployment Among Ages 30 to 34 years Comparison
Scotch-Irish
Whites/Caucasians
5.7%
UNEMPLOYMENT AMONG AGES 30 TO 34 YEARS
8.6/ 100
METRIC RATING
212th/ 347
METRIC RANK
5.7%
UNEMPLOYMENT AMONG AGES 30 TO 34 YEARS
9.2/ 100
METRIC RATING
210th/ 347
METRIC RANK
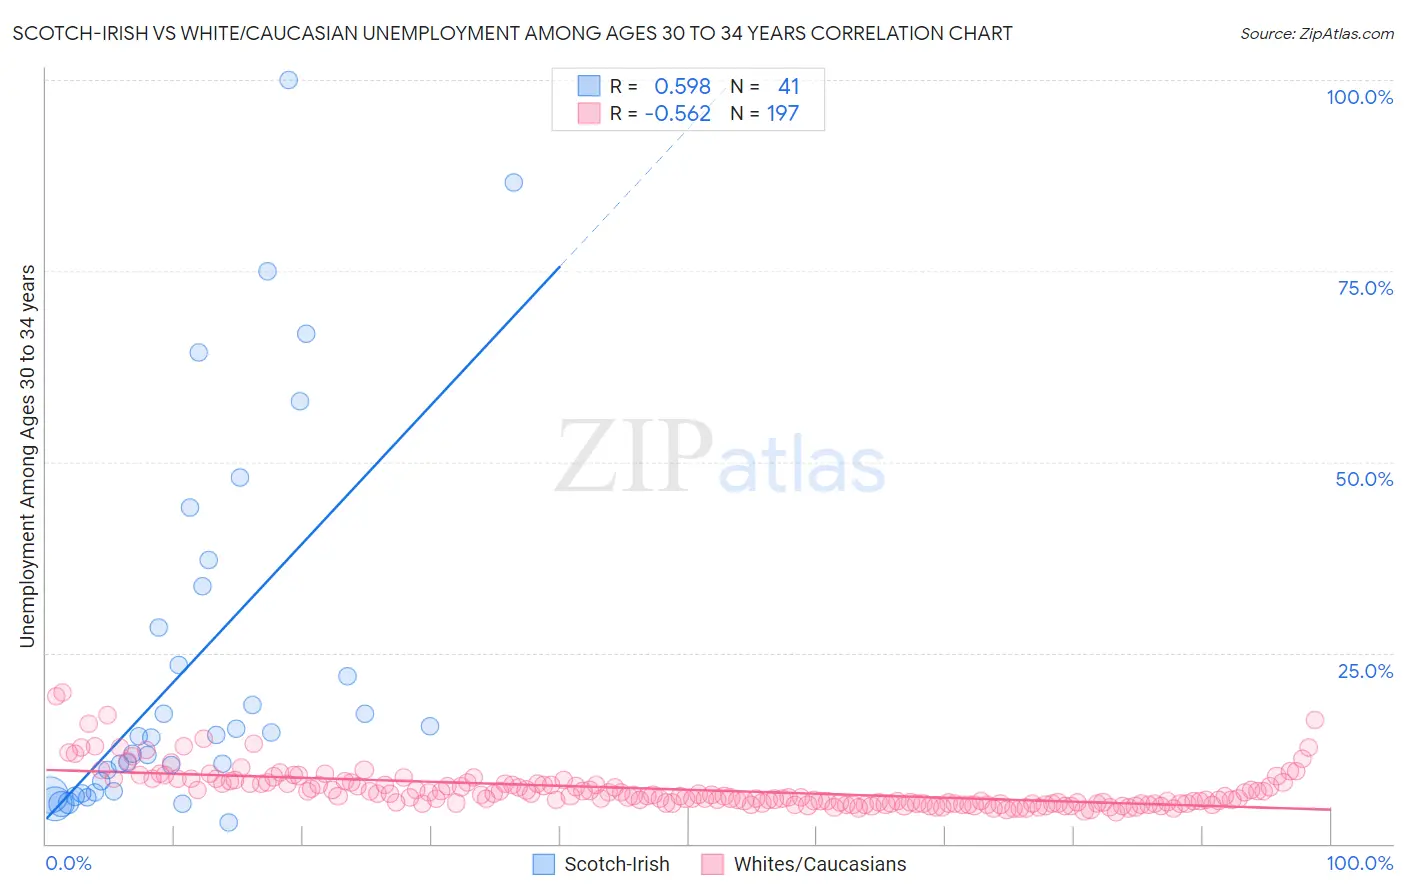
Scotch-Irish vs White/Caucasian Unemployment Among Ages 30 to 34 years Correlation Chart
The statistical analysis conducted on geographies consisting of 482,054,046 people shows a substantial positive correlation between the proportion of Scotch-Irish and unemployment rate among population between the ages 30 and 34 in the United States with a correlation coefficient (R) of 0.598 and weighted average of 5.7%. Similarly, the statistical analysis conducted on geographies consisting of 504,774,287 people shows a substantial negative correlation between the proportion of Whites/Caucasians and unemployment rate among population between the ages 30 and 34 in the United States with a correlation coefficient (R) of -0.562 and weighted average of 5.7%, a difference of 0.11%.
Unemployment Among Ages 30 to 34 years Correlation Summary
| Measurement | Scotch-Irish | White/Caucasian |
| Minimum | 2.8% | 4.2% |
| Maximum | 100.0% | 19.7% |
| Range | 97.2% | 15.6% |
| Mean | 23.7% | 7.1% |
| Median | 14.0% | 6.2% |
| Interquartile 25% (IQ1) | 6.8% | 5.3% |
| Interquartile 75% (IQ3) | 31.1% | 8.0% |
| Interquartile Range (IQR) | 24.3% | 2.7% |
| Standard Deviation (Sample) | 24.5% | 2.6% |
| Standard Deviation (Population) | 24.2% | 2.6% |
Demographics Similar to Scotch-Irish and Whites/Caucasians by Unemployment Among Ages 30 to 34 years
In terms of unemployment among ages 30 to 34 years, the demographic groups most similar to Scotch-Irish are Spanish American Indian (5.7%, a difference of 0.010%), Immigrants (5.7%, a difference of 0.35%), French (5.7%, a difference of 0.42%), Immigrants from Philippines (5.7%, a difference of 0.54%), and Immigrants from Panama (5.7%, a difference of 0.69%). Similarly, the demographic groups most similar to Whites/Caucasians are Spanish American Indian (5.7%, a difference of 0.10%), French (5.7%, a difference of 0.31%), Immigrants from Philippines (5.7%, a difference of 0.43%), Immigrants (5.7%, a difference of 0.47%), and Israeli (5.6%, a difference of 0.64%).
| Demographics | Rating | Rank | Unemployment Among Ages 30 to 34 years |
| South American Indians | 24.4 /100 | #201 | Fair 5.6% |
| Immigrants | Germany | 22.9 /100 | #202 | Fair 5.6% |
| Koreans | 20.7 /100 | #203 | Fair 5.6% |
| Immigrants | Cameroon | 18.4 /100 | #204 | Poor 5.6% |
| Immigrants | Costa Rica | 14.4 /100 | #205 | Poor 5.6% |
| Alsatians | 14.3 /100 | #206 | Poor 5.6% |
| Israelis | 12.8 /100 | #207 | Poor 5.6% |
| Immigrants | Philippines | 11.5 /100 | #208 | Poor 5.7% |
| French | 10.8 /100 | #209 | Poor 5.7% |
| Whites/Caucasians | 9.2 /100 | #210 | Tragic 5.7% |
| Spanish American Indians | 8.7 /100 | #211 | Tragic 5.7% |
| Scotch-Irish | 8.6 /100 | #212 | Tragic 5.7% |
| Immigrants | Immigrants | 7.1 /100 | #213 | Tragic 5.7% |
| Immigrants | Panama | 5.9 /100 | #214 | Tragic 5.7% |
| Immigrants | Cambodia | 5.8 /100 | #215 | Tragic 5.7% |
| Immigrants | Syria | 5.5 /100 | #216 | Tragic 5.7% |
| Immigrants | Fiji | 5.1 /100 | #217 | Tragic 5.7% |
| Panamanians | 4.5 /100 | #218 | Tragic 5.8% |
| French Canadians | 4.4 /100 | #219 | Tragic 5.8% |
| Sierra Leoneans | 3.9 /100 | #220 | Tragic 5.8% |
| Guamanians/Chamorros | 3.9 /100 | #221 | Tragic 5.8% |