Scotch-Irish vs African Child Poverty Under the Age of 16
COMPARE
Scotch-Irish
African
Child Poverty Under the Age of 16
Child Poverty Under the Age of 16 Comparison
Scotch-Irish
Africans
16.3%
CHILD POVERTY UNDER THE AGE OF 16
47.1/ 100
METRIC RATING
175th/ 347
METRIC RANK
21.7%
CHILD POVERTY UNDER THE AGE OF 16
0.0/ 100
METRIC RATING
316th/ 347
METRIC RANK
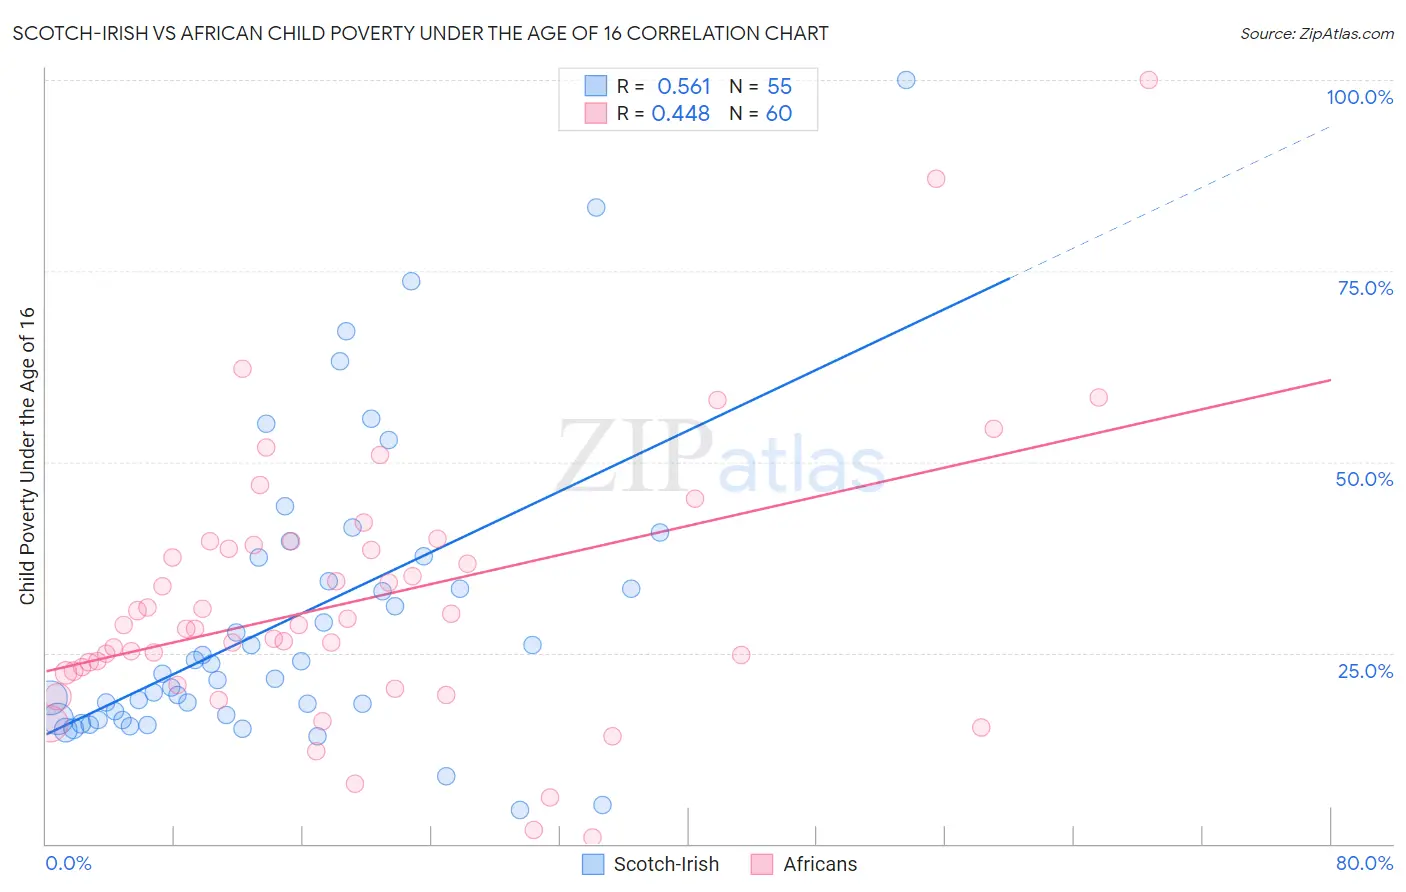
Scotch-Irish vs African Child Poverty Under the Age of 16 Correlation Chart
The statistical analysis conducted on geographies consisting of 537,994,526 people shows a substantial positive correlation between the proportion of Scotch-Irish and poverty level among children under the age of 16 in the United States with a correlation coefficient (R) of 0.561 and weighted average of 16.3%. Similarly, the statistical analysis conducted on geographies consisting of 466,270,452 people shows a moderate positive correlation between the proportion of Africans and poverty level among children under the age of 16 in the United States with a correlation coefficient (R) of 0.448 and weighted average of 21.7%, a difference of 33.5%.
Child Poverty Under the Age of 16 Correlation Summary
| Measurement | Scotch-Irish | African |
| Minimum | 4.3% | 0.88% |
| Maximum | 100.0% | 100.0% |
| Range | 95.7% | 99.1% |
| Mean | 29.5% | 31.8% |
| Median | 22.3% | 28.4% |
| Interquartile 25% (IQ1) | 16.3% | 22.5% |
| Interquartile 75% (IQ3) | 37.5% | 38.9% |
| Interquartile Range (IQR) | 21.2% | 16.5% |
| Standard Deviation (Sample) | 19.5% | 17.6% |
| Standard Deviation (Population) | 19.3% | 17.5% |
Similar Demographics by Child Poverty Under the Age of 16
Demographics Similar to Scotch-Irish by Child Poverty Under the Age of 16
In terms of child poverty under the age of 16, the demographic groups most similar to Scotch-Irish are Lebanese (16.3%, a difference of 0.15%), White/Caucasian (16.2%, a difference of 0.34%), Ethiopian (16.3%, a difference of 0.45%), Immigrants from Ethiopia (16.4%, a difference of 0.58%), and Immigrants from Syria (16.4%, a difference of 0.59%).
| Demographics | Rating | Rank | Child Poverty Under the Age of 16 |
| South Americans | 57.9 /100 | #168 | Average 16.0% |
| Uruguayans | 54.7 /100 | #169 | Average 16.1% |
| Immigrants | Colombia | 54.4 /100 | #170 | Average 16.1% |
| Hungarians | 52.5 /100 | #171 | Average 16.2% |
| Afghans | 52.3 /100 | #172 | Average 16.2% |
| Immigrants | Saudi Arabia | 52.1 /100 | #173 | Average 16.2% |
| Whites/Caucasians | 50.0 /100 | #174 | Average 16.2% |
| Scotch-Irish | 47.1 /100 | #175 | Average 16.3% |
| Lebanese | 45.9 /100 | #176 | Average 16.3% |
| Ethiopians | 43.4 /100 | #177 | Average 16.3% |
| Immigrants | Ethiopia | 42.3 /100 | #178 | Average 16.4% |
| Immigrants | Syria | 42.3 /100 | #179 | Average 16.4% |
| South American Indians | 41.8 /100 | #180 | Average 16.4% |
| Immigrants | South America | 40.8 /100 | #181 | Average 16.4% |
| Hawaiians | 38.2 /100 | #182 | Fair 16.4% |
Demographics Similar to Africans by Child Poverty Under the Age of 16
In terms of child poverty under the age of 16, the demographic groups most similar to Africans are Immigrants from Guatemala (21.6%, a difference of 0.42%), Immigrants from Somalia (21.6%, a difference of 0.56%), Creek (21.5%, a difference of 0.76%), Immigrants from Dominica (21.9%, a difference of 0.77%), and Ute (21.5%, a difference of 0.79%).
| Demographics | Rating | Rank | Child Poverty Under the Age of 16 |
| Immigrants | Mexico | 0.0 /100 | #309 | Tragic 21.5% |
| Bahamians | 0.0 /100 | #310 | Tragic 21.5% |
| Dutch West Indians | 0.0 /100 | #311 | Tragic 21.5% |
| Ute | 0.0 /100 | #312 | Tragic 21.5% |
| Creek | 0.0 /100 | #313 | Tragic 21.5% |
| Immigrants | Somalia | 0.0 /100 | #314 | Tragic 21.6% |
| Immigrants | Guatemala | 0.0 /100 | #315 | Tragic 21.6% |
| Africans | 0.0 /100 | #316 | Tragic 21.7% |
| Immigrants | Dominica | 0.0 /100 | #317 | Tragic 21.9% |
| U.S. Virgin Islanders | 0.0 /100 | #318 | Tragic 22.0% |
| Yakama | 0.0 /100 | #319 | Tragic 22.1% |
| Cajuns | 0.0 /100 | #320 | Tragic 22.1% |
| Kiowa | 0.0 /100 | #321 | Tragic 22.2% |
| Hondurans | 0.0 /100 | #322 | Tragic 22.2% |
| Paiute | 0.0 /100 | #323 | Tragic 22.4% |