Samoan vs Austrian Unemployment Among Ages 35 to 44 years
COMPARE
Samoan
Austrian
Unemployment Among Ages 35 to 44 years
Unemployment Among Ages 35 to 44 years Comparison
Samoans
Austrians
5.0%
UNEMPLOYMENT AMONG AGES 35 TO 44 YEARS
1.8/ 100
METRIC RATING
228th/ 347
METRIC RANK
4.4%
UNEMPLOYMENT AMONG AGES 35 TO 44 YEARS
97.1/ 100
METRIC RATING
63rd/ 347
METRIC RANK
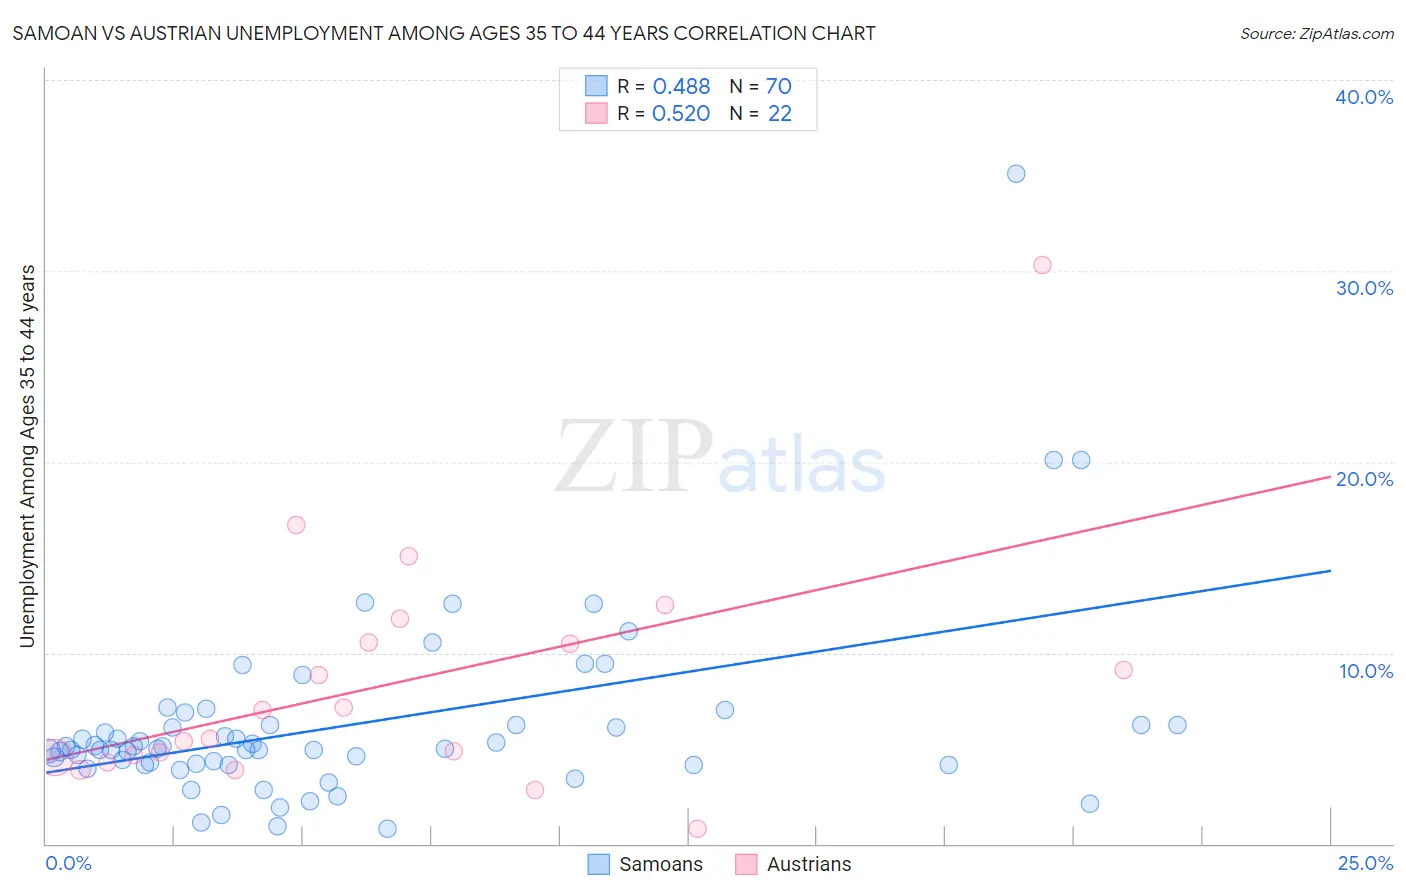
Samoan vs Austrian Unemployment Among Ages 35 to 44 years Correlation Chart
The statistical analysis conducted on geographies consisting of 222,580,294 people shows a moderate positive correlation between the proportion of Samoans and unemployment rate among population between the ages 35 and 44 in the United States with a correlation coefficient (R) of 0.488 and weighted average of 5.0%. Similarly, the statistical analysis conducted on geographies consisting of 435,230,489 people shows a substantial positive correlation between the proportion of Austrians and unemployment rate among population between the ages 35 and 44 in the United States with a correlation coefficient (R) of 0.520 and weighted average of 4.4%, a difference of 14.2%.
Unemployment Among Ages 35 to 44 years Correlation Summary
| Measurement | Samoan | Austrian |
| Minimum | 0.80% | 0.80% |
| Maximum | 35.1% | 30.3% |
| Range | 34.3% | 29.5% |
| Mean | 6.2% | 8.4% |
| Median | 5.0% | 6.2% |
| Interquartile 25% (IQ1) | 4.1% | 4.5% |
| Interquartile 75% (IQ3) | 6.2% | 10.6% |
| Interquartile Range (IQR) | 2.1% | 6.0% |
| Standard Deviation (Sample) | 5.0% | 6.4% |
| Standard Deviation (Population) | 5.0% | 6.2% |
Similar Demographics by Unemployment Among Ages 35 to 44 years
Demographics Similar to Samoans by Unemployment Among Ages 35 to 44 years
In terms of unemployment among ages 35 to 44 years, the demographic groups most similar to Samoans are Immigrants from Uzbekistan (5.0%, a difference of 0.15%), Immigrants from Cambodia (5.0%, a difference of 0.28%), Liberian (5.1%, a difference of 0.56%), Japanese (5.1%, a difference of 0.59%), and Potawatomi (5.0%, a difference of 0.62%).
| Demographics | Rating | Rank | Unemployment Among Ages 35 to 44 years |
| Bermudans | 3.9 /100 | #221 | Tragic 5.0% |
| Hmong | 3.5 /100 | #222 | Tragic 5.0% |
| Immigrants | Panama | 3.3 /100 | #223 | Tragic 5.0% |
| Panamanians | 2.9 /100 | #224 | Tragic 5.0% |
| Immigrants | Lebanon | 2.7 /100 | #225 | Tragic 5.0% |
| Potawatomi | 2.5 /100 | #226 | Tragic 5.0% |
| Immigrants | Uzbekistan | 1.9 /100 | #227 | Tragic 5.0% |
| Samoans | 1.8 /100 | #228 | Tragic 5.0% |
| Immigrants | Cambodia | 1.5 /100 | #229 | Tragic 5.0% |
| Liberians | 1.3 /100 | #230 | Tragic 5.1% |
| Japanese | 1.2 /100 | #231 | Tragic 5.1% |
| Iroquois | 1.2 /100 | #232 | Tragic 5.1% |
| Immigrants | Nigeria | 1.2 /100 | #233 | Tragic 5.1% |
| Portuguese | 1.1 /100 | #234 | Tragic 5.1% |
| Guamanians/Chamorros | 0.9 /100 | #235 | Tragic 5.1% |
Demographics Similar to Austrians by Unemployment Among Ages 35 to 44 years
In terms of unemployment among ages 35 to 44 years, the demographic groups most similar to Austrians are Croatian (4.4%, a difference of 0.010%), Immigrants from Bulgaria (4.4%, a difference of 0.010%), Taiwanese (4.4%, a difference of 0.020%), Immigrants from Serbia (4.4%, a difference of 0.020%), and Greek (4.4%, a difference of 0.050%).
| Demographics | Rating | Rank | Unemployment Among Ages 35 to 44 years |
| Chileans | 97.3 /100 | #56 | Exceptional 4.4% |
| Immigrants | Hong Kong | 97.2 /100 | #57 | Exceptional 4.4% |
| English | 97.2 /100 | #58 | Exceptional 4.4% |
| Greeks | 97.1 /100 | #59 | Exceptional 4.4% |
| Taiwanese | 97.1 /100 | #60 | Exceptional 4.4% |
| Croatians | 97.1 /100 | #61 | Exceptional 4.4% |
| Immigrants | Bulgaria | 97.1 /100 | #62 | Exceptional 4.4% |
| Austrians | 97.1 /100 | #63 | Exceptional 4.4% |
| Immigrants | Serbia | 97.0 /100 | #64 | Exceptional 4.4% |
| Cambodians | 97.0 /100 | #65 | Exceptional 4.4% |
| Icelanders | 96.8 /100 | #66 | Exceptional 4.4% |
| Argentineans | 96.8 /100 | #67 | Exceptional 4.4% |
| Immigrants | Ireland | 96.8 /100 | #68 | Exceptional 4.4% |
| Slovenes | 96.7 /100 | #69 | Exceptional 4.4% |
| Immigrants | China | 96.7 /100 | #70 | Exceptional 4.4% |