Samoan vs Danish Unemployment Among Ages 35 to 44 years
COMPARE
Samoan
Danish
Unemployment Among Ages 35 to 44 years
Unemployment Among Ages 35 to 44 years Comparison
Samoans
Danes
5.0%
UNEMPLOYMENT AMONG AGES 35 TO 44 YEARS
1.8/ 100
METRIC RATING
228th/ 347
METRIC RANK
4.1%
UNEMPLOYMENT AMONG AGES 35 TO 44 YEARS
99.9/ 100
METRIC RATING
9th/ 347
METRIC RANK
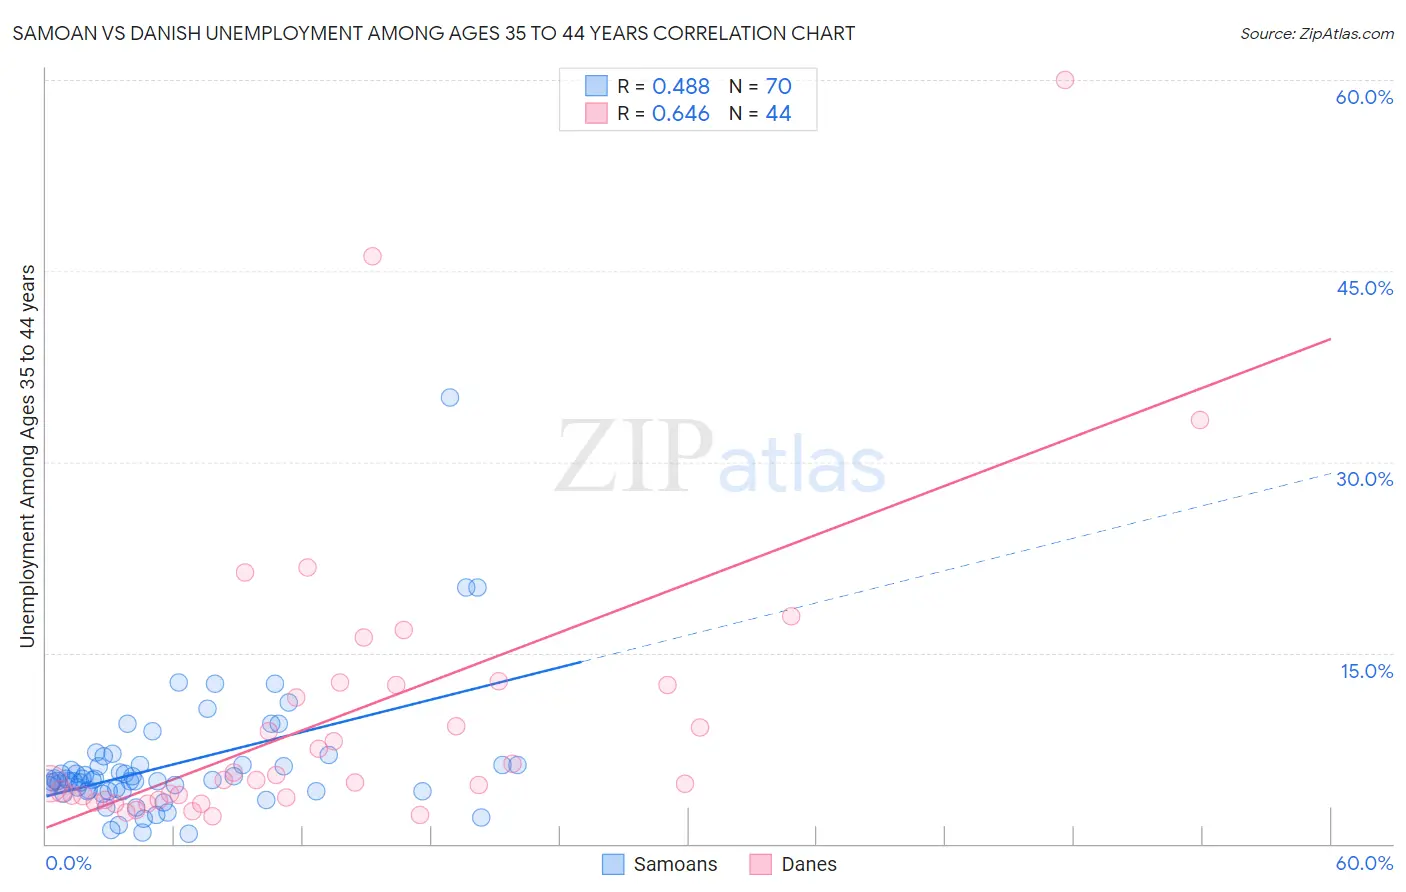
Samoan vs Danish Unemployment Among Ages 35 to 44 years Correlation Chart
The statistical analysis conducted on geographies consisting of 222,580,294 people shows a moderate positive correlation between the proportion of Samoans and unemployment rate among population between the ages 35 and 44 in the United States with a correlation coefficient (R) of 0.488 and weighted average of 5.0%. Similarly, the statistical analysis conducted on geographies consisting of 452,726,359 people shows a significant positive correlation between the proportion of Danes and unemployment rate among population between the ages 35 and 44 in the United States with a correlation coefficient (R) of 0.646 and weighted average of 4.1%, a difference of 22.3%.
Unemployment Among Ages 35 to 44 years Correlation Summary
| Measurement | Samoan | Danish |
| Minimum | 0.80% | 2.1% |
| Maximum | 35.1% | 60.0% |
| Range | 34.3% | 57.9% |
| Mean | 6.2% | 10.0% |
| Median | 5.0% | 5.0% |
| Interquartile 25% (IQ1) | 4.1% | 3.5% |
| Interquartile 75% (IQ3) | 6.2% | 12.5% |
| Interquartile Range (IQR) | 2.1% | 9.0% |
| Standard Deviation (Sample) | 5.0% | 11.6% |
| Standard Deviation (Population) | 5.0% | 11.5% |
Similar Demographics by Unemployment Among Ages 35 to 44 years
Demographics Similar to Samoans by Unemployment Among Ages 35 to 44 years
In terms of unemployment among ages 35 to 44 years, the demographic groups most similar to Samoans are Immigrants from Uzbekistan (5.0%, a difference of 0.15%), Immigrants from Cambodia (5.0%, a difference of 0.28%), Liberian (5.1%, a difference of 0.56%), Japanese (5.1%, a difference of 0.59%), and Potawatomi (5.0%, a difference of 0.62%).
| Demographics | Rating | Rank | Unemployment Among Ages 35 to 44 years |
| Bermudans | 3.9 /100 | #221 | Tragic 5.0% |
| Hmong | 3.5 /100 | #222 | Tragic 5.0% |
| Immigrants | Panama | 3.3 /100 | #223 | Tragic 5.0% |
| Panamanians | 2.9 /100 | #224 | Tragic 5.0% |
| Immigrants | Lebanon | 2.7 /100 | #225 | Tragic 5.0% |
| Potawatomi | 2.5 /100 | #226 | Tragic 5.0% |
| Immigrants | Uzbekistan | 1.9 /100 | #227 | Tragic 5.0% |
| Samoans | 1.8 /100 | #228 | Tragic 5.0% |
| Immigrants | Cambodia | 1.5 /100 | #229 | Tragic 5.0% |
| Liberians | 1.3 /100 | #230 | Tragic 5.1% |
| Japanese | 1.2 /100 | #231 | Tragic 5.1% |
| Iroquois | 1.2 /100 | #232 | Tragic 5.1% |
| Immigrants | Nigeria | 1.2 /100 | #233 | Tragic 5.1% |
| Portuguese | 1.1 /100 | #234 | Tragic 5.1% |
| Guamanians/Chamorros | 0.9 /100 | #235 | Tragic 5.1% |
Demographics Similar to Danes by Unemployment Among Ages 35 to 44 years
In terms of unemployment among ages 35 to 44 years, the demographic groups most similar to Danes are Immigrants from South Central Asia (4.1%, a difference of 0.080%), Immigrants from Cuba (4.1%, a difference of 0.65%), Immigrants from Singapore (4.1%, a difference of 0.66%), Sudanese (4.1%, a difference of 0.72%), and Venezuelan (4.1%, a difference of 0.82%).
| Demographics | Rating | Rank | Unemployment Among Ages 35 to 44 years |
| Thais | 100.0 /100 | #2 | Exceptional 3.9% |
| Norwegians | 100.0 /100 | #3 | Exceptional 4.0% |
| Immigrants | Taiwan | 100.0 /100 | #4 | Exceptional 4.0% |
| Filipinos | 100.0 /100 | #5 | Exceptional 4.0% |
| Immigrants | Venezuela | 100.0 /100 | #6 | Exceptional 4.0% |
| Immigrants | Cuba | 99.9 /100 | #7 | Exceptional 4.1% |
| Immigrants | South Central Asia | 99.9 /100 | #8 | Exceptional 4.1% |
| Danes | 99.9 /100 | #9 | Exceptional 4.1% |
| Immigrants | Singapore | 99.9 /100 | #10 | Exceptional 4.1% |
| Sudanese | 99.9 /100 | #11 | Exceptional 4.1% |
| Venezuelans | 99.9 /100 | #12 | Exceptional 4.1% |
| Bolivians | 99.9 /100 | #13 | Exceptional 4.1% |
| Czechs | 99.9 /100 | #14 | Exceptional 4.1% |
| Tongans | 99.8 /100 | #15 | Exceptional 4.2% |
| Cubans | 99.8 /100 | #16 | Exceptional 4.2% |