Salvadoran vs Immigrants from El Salvador Unemployment Among Ages 20 to 24 years
COMPARE
Salvadoran
Immigrants from El Salvador
Unemployment Among Ages 20 to 24 years
Unemployment Among Ages 20 to 24 years Comparison
Salvadorans
Immigrants from El Salvador
10.7%
UNEMPLOYMENT AMONG AGES 20 TO 24 YEARS
2.4/ 100
METRIC RATING
239th/ 347
METRIC RANK
10.7%
UNEMPLOYMENT AMONG AGES 20 TO 24 YEARS
1.7/ 100
METRIC RATING
241st/ 347
METRIC RANK
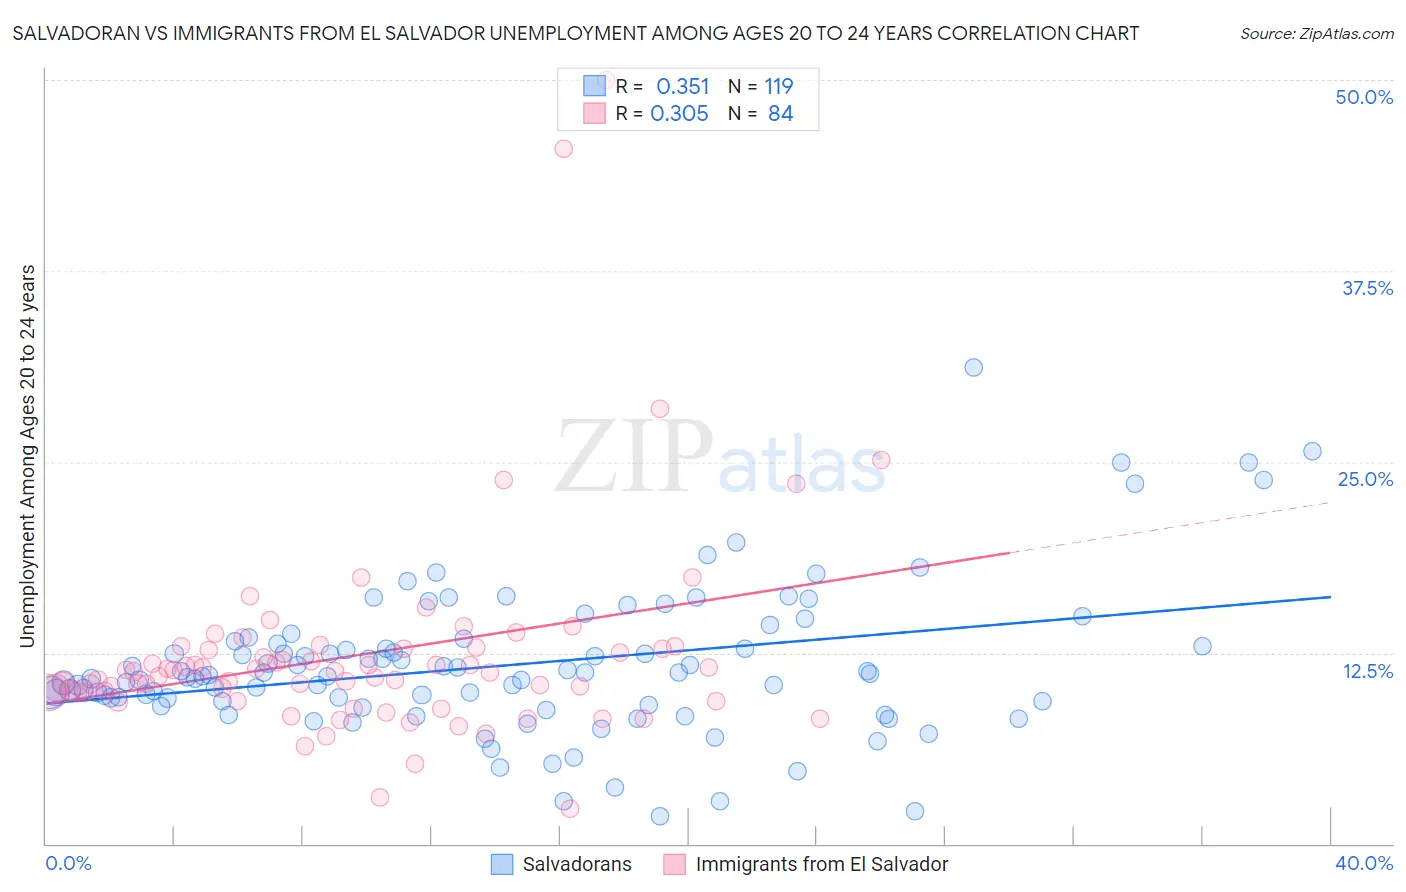
Salvadoran vs Immigrants from El Salvador Unemployment Among Ages 20 to 24 years Correlation Chart
The statistical analysis conducted on geographies consisting of 387,862,775 people shows a mild positive correlation between the proportion of Salvadorans and unemployment rate among population between the ages 20 and 24 in the United States with a correlation coefficient (R) of 0.351 and weighted average of 10.7%. Similarly, the statistical analysis conducted on geographies consisting of 349,154,208 people shows a mild positive correlation between the proportion of Immigrants from El Salvador and unemployment rate among population between the ages 20 and 24 in the United States with a correlation coefficient (R) of 0.305 and weighted average of 10.7%, a difference of 0.33%.
Unemployment Among Ages 20 to 24 years Correlation Summary
| Measurement | Salvadoran | Immigrants from El Salvador |
| Minimum | 1.8% | 2.3% |
| Maximum | 31.2% | 50.0% |
| Range | 29.4% | 47.7% |
| Mean | 11.7% | 12.4% |
| Median | 11.0% | 11.2% |
| Interquartile 25% (IQ1) | 9.3% | 9.9% |
| Interquartile 75% (IQ3) | 13.1% | 12.8% |
| Interquartile Range (IQR) | 3.8% | 2.9% |
| Standard Deviation (Sample) | 4.8% | 6.9% |
| Standard Deviation (Population) | 4.7% | 6.8% |
Demographics Similar to Salvadorans and Immigrants from El Salvador by Unemployment Among Ages 20 to 24 years
In terms of unemployment among ages 20 to 24 years, the demographic groups most similar to Salvadorans are Immigrants from Pakistan (10.6%, a difference of 0.060%), Immigrants (10.6%, a difference of 0.080%), Immigrants from Central America (10.7%, a difference of 0.19%), Mexican (10.6%, a difference of 0.25%), and Immigrants from Ukraine (10.6%, a difference of 0.29%). Similarly, the demographic groups most similar to Immigrants from El Salvador are Immigrants from Central America (10.7%, a difference of 0.14%), Moroccan (10.7%, a difference of 0.17%), Immigrants from Belarus (10.7%, a difference of 0.21%), Immigrants from Mexico (10.7%, a difference of 0.27%), and Immigrants from Pakistan (10.6%, a difference of 0.39%).
| Demographics | Rating | Rank | Unemployment Among Ages 20 to 24 years |
| French American Indians | 4.1 /100 | #230 | Tragic 10.6% |
| Native Hawaiians | 3.9 /100 | #231 | Tragic 10.6% |
| Israelis | 3.7 /100 | #232 | Tragic 10.6% |
| Choctaw | 3.6 /100 | #233 | Tragic 10.6% |
| Immigrants | Africa | 3.5 /100 | #234 | Tragic 10.6% |
| Immigrants | Ukraine | 3.3 /100 | #235 | Tragic 10.6% |
| Mexicans | 3.2 /100 | #236 | Tragic 10.6% |
| Immigrants | Immigrants | 2.7 /100 | #237 | Tragic 10.6% |
| Immigrants | Pakistan | 2.6 /100 | #238 | Tragic 10.6% |
| Salvadorans | 2.4 /100 | #239 | Tragic 10.7% |
| Immigrants | Central America | 2.0 /100 | #240 | Tragic 10.7% |
| Immigrants | El Salvador | 1.7 /100 | #241 | Tragic 10.7% |
| Moroccans | 1.4 /100 | #242 | Tragic 10.7% |
| Immigrants | Belarus | 1.3 /100 | #243 | Tragic 10.7% |
| Immigrants | Mexico | 1.2 /100 | #244 | Tragic 10.7% |
| Hispanics or Latinos | 1.0 /100 | #245 | Tragic 10.7% |
| Immigrants | Iran | 0.9 /100 | #246 | Tragic 10.8% |
| Immigrants | Albania | 0.7 /100 | #247 | Tragic 10.8% |
| Cree | 0.6 /100 | #248 | Tragic 10.8% |
| South American Indians | 0.5 /100 | #249 | Tragic 10.8% |
| Albanians | 0.5 /100 | #250 | Tragic 10.8% |