Guamanian/Chamorro vs Mexican Unemployment
COMPARE
Guamanian/Chamorro
Mexican
Unemployment
Unemployment Comparison
Guamanians/Chamorros
Mexicans
5.5%
UNEMPLOYMENT
6.3/ 100
METRIC RATING
228th/ 347
METRIC RANK
5.9%
UNEMPLOYMENT
0.1/ 100
METRIC RATING
271st/ 347
METRIC RANK
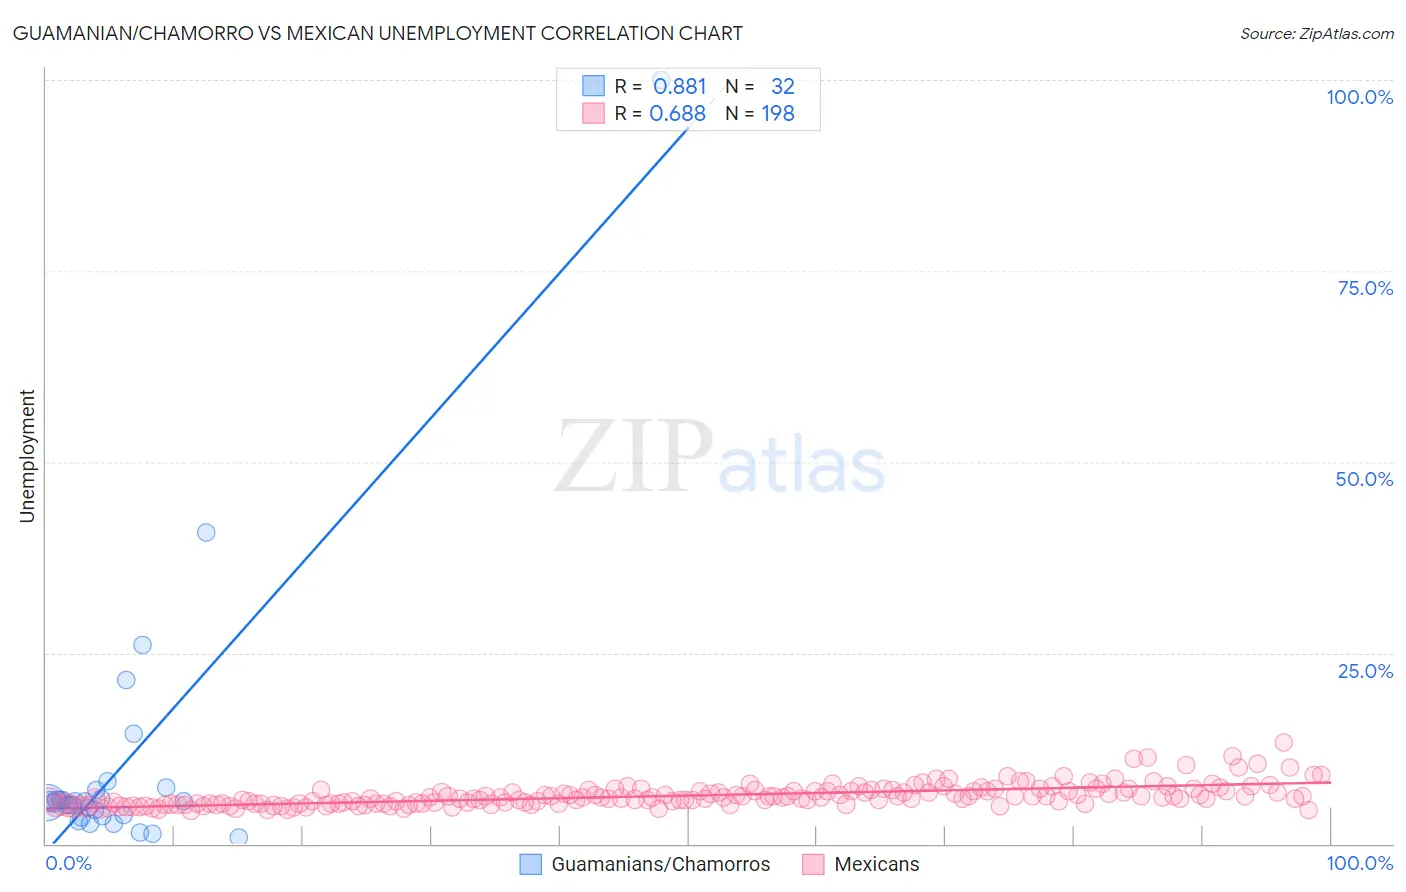
Guamanian/Chamorro vs Mexican Unemployment Correlation Chart
The statistical analysis conducted on geographies consisting of 221,788,183 people shows a very strong positive correlation between the proportion of Guamanians/Chamorros and unemployment in the United States with a correlation coefficient (R) of 0.881 and weighted average of 5.5%. Similarly, the statistical analysis conducted on geographies consisting of 561,800,236 people shows a significant positive correlation between the proportion of Mexicans and unemployment in the United States with a correlation coefficient (R) of 0.688 and weighted average of 5.9%, a difference of 7.0%.
Unemployment Correlation Summary
| Measurement | Guamanian/Chamorro | Mexican |
| Minimum | 0.80% | 4.4% |
| Maximum | 100.0% | 13.3% |
| Range | 99.2% | 8.9% |
| Mean | 10.3% | 6.3% |
| Median | 5.5% | 6.0% |
| Interquartile 25% (IQ1) | 3.6% | 5.2% |
| Interquartile 75% (IQ3) | 6.5% | 6.9% |
| Interquartile Range (IQR) | 2.8% | 1.7% |
| Standard Deviation (Sample) | 18.2% | 1.4% |
| Standard Deviation (Population) | 17.9% | 1.4% |
Similar Demographics by Unemployment
Demographics Similar to Guamanians/Chamorros by Unemployment
In terms of unemployment, the demographic groups most similar to Guamanians/Chamorros are Immigrants from Lebanon (5.5%, a difference of 0.15%), Samoan (5.5%, a difference of 0.18%), Hawaiian (5.5%, a difference of 0.26%), Ottawa (5.5%, a difference of 0.26%), and South American Indian (5.5%, a difference of 0.33%).
| Demographics | Rating | Rank | Unemployment |
| Immigrants | Philippines | 10.4 /100 | #221 | Poor 5.4% |
| Iroquois | 10.3 /100 | #222 | Poor 5.4% |
| Seminole | 9.2 /100 | #223 | Tragic 5.4% |
| Israelis | 8.8 /100 | #224 | Tragic 5.4% |
| South American Indians | 7.8 /100 | #225 | Tragic 5.5% |
| Samoans | 7.1 /100 | #226 | Tragic 5.5% |
| Immigrants | Lebanon | 7.0 /100 | #227 | Tragic 5.5% |
| Guamanians/Chamorros | 6.3 /100 | #228 | Tragic 5.5% |
| Hawaiians | 5.4 /100 | #229 | Tragic 5.5% |
| Ottawa | 5.4 /100 | #230 | Tragic 5.5% |
| Immigrants | Africa | 4.9 /100 | #231 | Tragic 5.5% |
| Comanche | 4.9 /100 | #232 | Tragic 5.5% |
| Immigrants | Syria | 4.8 /100 | #233 | Tragic 5.5% |
| Panamanians | 4.7 /100 | #234 | Tragic 5.5% |
| Immigrants | Panama | 3.4 /100 | #235 | Tragic 5.5% |
Demographics Similar to Mexicans by Unemployment
In terms of unemployment, the demographic groups most similar to Mexicans are Blackfeet (5.8%, a difference of 0.23%), Immigrants from El Salvador (5.8%, a difference of 0.31%), Immigrants from Sierra Leone (5.8%, a difference of 0.32%), Immigrants from Nigeria (5.8%, a difference of 0.36%), and Mexican American Indian (5.8%, a difference of 0.43%).
| Demographics | Rating | Rank | Unemployment |
| Immigrants | Liberia | 0.1 /100 | #264 | Tragic 5.8% |
| Nigerians | 0.1 /100 | #265 | Tragic 5.8% |
| Mexican American Indians | 0.1 /100 | #266 | Tragic 5.8% |
| Immigrants | Nigeria | 0.1 /100 | #267 | Tragic 5.8% |
| Immigrants | Sierra Leone | 0.1 /100 | #268 | Tragic 5.8% |
| Immigrants | El Salvador | 0.1 /100 | #269 | Tragic 5.8% |
| Blackfeet | 0.1 /100 | #270 | Tragic 5.8% |
| Mexicans | 0.1 /100 | #271 | Tragic 5.9% |
| Hispanics or Latinos | 0.0 /100 | #272 | Tragic 5.9% |
| Immigrants | Fiji | 0.0 /100 | #273 | Tragic 5.9% |
| Bahamians | 0.0 /100 | #274 | Tragic 5.9% |
| Immigrants | Latin America | 0.0 /100 | #275 | Tragic 5.9% |
| Immigrants | Central America | 0.0 /100 | #276 | Tragic 6.0% |
| Armenians | 0.0 /100 | #277 | Tragic 6.0% |
| Ghanaians | 0.0 /100 | #278 | Tragic 6.0% |