Finnish vs Immigrants from Norway Female Unemployment
COMPARE
Finnish
Immigrants from Norway
Female Unemployment
Female Unemployment Comparison
Finns
Immigrants from Norway
4.6%
FEMALE UNEMPLOYMENT
100.0/ 100
METRIC RATING
14th/ 347
METRIC RANK
5.2%
FEMALE UNEMPLOYMENT
79.4/ 100
METRIC RATING
146th/ 347
METRIC RANK
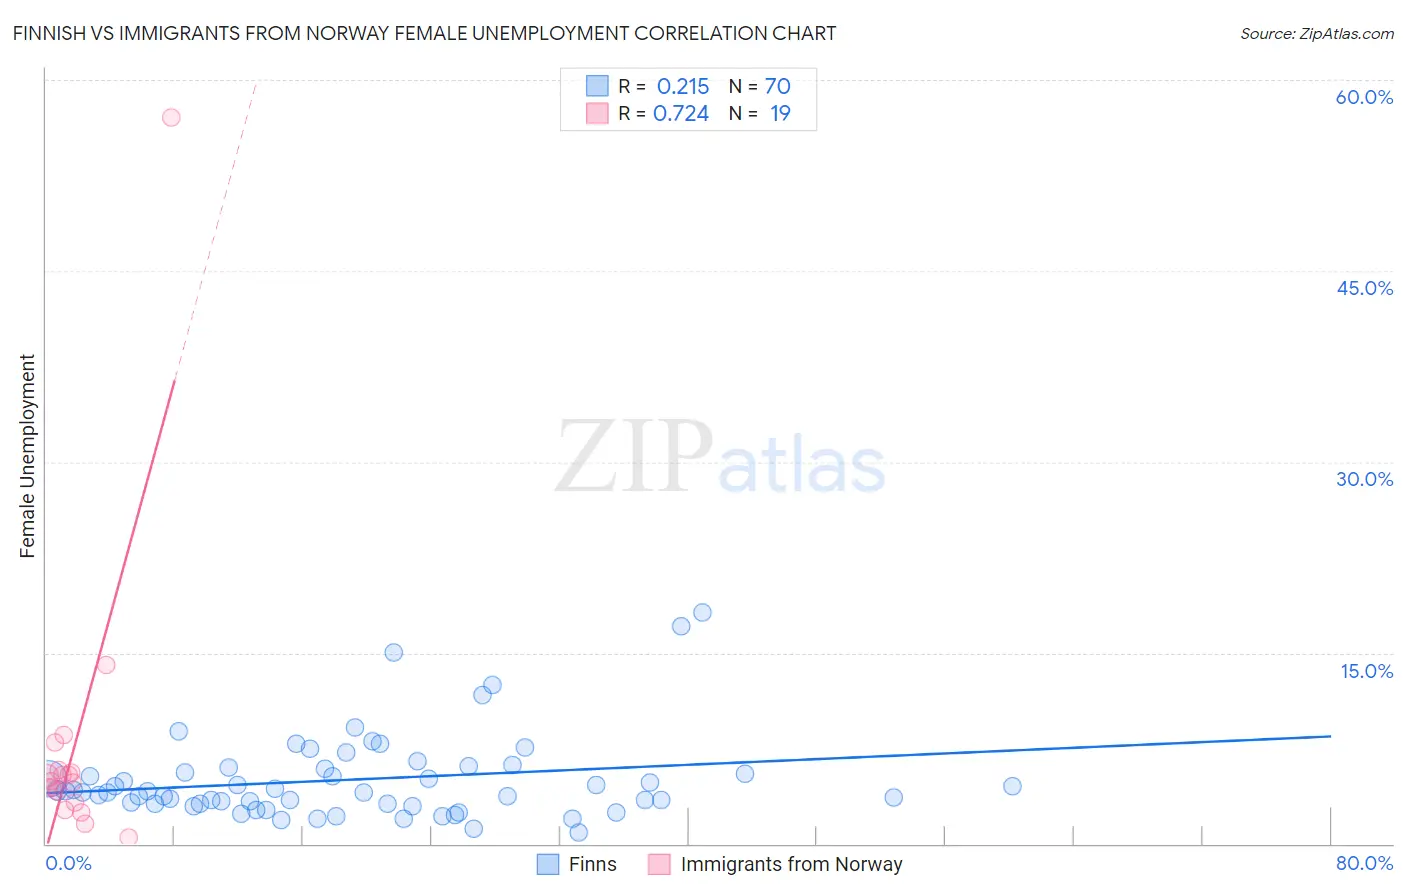
Finnish vs Immigrants from Norway Female Unemployment Correlation Chart
The statistical analysis conducted on geographies consisting of 401,070,094 people shows a weak positive correlation between the proportion of Finns and unemploymnet rate among females in the United States with a correlation coefficient (R) of 0.215 and weighted average of 4.6%. Similarly, the statistical analysis conducted on geographies consisting of 116,500,173 people shows a strong positive correlation between the proportion of Immigrants from Norway and unemploymnet rate among females in the United States with a correlation coefficient (R) of 0.724 and weighted average of 5.2%, a difference of 11.4%.
Female Unemployment Correlation Summary
| Measurement | Finnish | Immigrants from Norway |
| Minimum | 0.90% | 0.50% |
| Maximum | 18.2% | 57.1% |
| Range | 17.3% | 56.6% |
| Mean | 5.0% | 7.8% |
| Median | 4.1% | 4.9% |
| Interquartile 25% (IQ1) | 3.2% | 3.2% |
| Interquartile 75% (IQ3) | 5.9% | 5.8% |
| Interquartile Range (IQR) | 2.7% | 2.6% |
| Standard Deviation (Sample) | 3.4% | 12.3% |
| Standard Deviation (Population) | 3.3% | 12.0% |
Similar Demographics by Female Unemployment
Demographics Similar to Finns by Female Unemployment
In terms of female unemployment, the demographic groups most similar to Finns are English (4.6%, a difference of 0.20%), Belgian (4.6%, a difference of 0.59%), Dutch (4.6%, a difference of 0.75%), Carpatho Rusyn (4.7%, a difference of 1.1%), and Croatian (4.7%, a difference of 1.1%).
| Demographics | Rating | Rank | Female Unemployment |
| Chinese | 100.0 /100 | #7 | Exceptional 4.5% |
| Germans | 100.0 /100 | #8 | Exceptional 4.5% |
| Slovenes | 100.0 /100 | #9 | Exceptional 4.5% |
| Swiss | 100.0 /100 | #10 | Exceptional 4.6% |
| Scandinavians | 100.0 /100 | #11 | Exceptional 4.6% |
| Dutch | 100.0 /100 | #12 | Exceptional 4.6% |
| Belgians | 100.0 /100 | #13 | Exceptional 4.6% |
| Finns | 100.0 /100 | #14 | Exceptional 4.6% |
| English | 100.0 /100 | #15 | Exceptional 4.6% |
| Carpatho Rusyns | 99.9 /100 | #16 | Exceptional 4.7% |
| Croatians | 99.9 /100 | #17 | Exceptional 4.7% |
| Latvians | 99.9 /100 | #18 | Exceptional 4.7% |
| Poles | 99.9 /100 | #19 | Exceptional 4.7% |
| Bulgarians | 99.9 /100 | #20 | Exceptional 4.7% |
| Fijians | 99.9 /100 | #21 | Exceptional 4.7% |
Demographics Similar to Immigrants from Norway by Female Unemployment
In terms of female unemployment, the demographic groups most similar to Immigrants from Norway are Immigrants from Oceania (5.2%, a difference of 0.010%), Argentinean (5.2%, a difference of 0.020%), Immigrants from Argentina (5.2%, a difference of 0.060%), Immigrants from Jordan (5.1%, a difference of 0.10%), and Asian (5.2%, a difference of 0.10%).
| Demographics | Rating | Rank | Female Unemployment |
| Immigrants | Eastern Asia | 83.0 /100 | #139 | Excellent 5.1% |
| Immigrants | France | 82.7 /100 | #140 | Excellent 5.1% |
| Immigrants | Eastern Europe | 81.5 /100 | #141 | Excellent 5.1% |
| Palestinians | 80.8 /100 | #142 | Excellent 5.1% |
| Immigrants | Kazakhstan | 80.7 /100 | #143 | Excellent 5.1% |
| Immigrants | Jordan | 80.4 /100 | #144 | Excellent 5.1% |
| Immigrants | Oceania | 79.5 /100 | #145 | Good 5.2% |
| Immigrants | Norway | 79.4 /100 | #146 | Good 5.2% |
| Argentineans | 79.2 /100 | #147 | Good 5.2% |
| Immigrants | Argentina | 78.7 /100 | #148 | Good 5.2% |
| Asians | 78.3 /100 | #149 | Good 5.2% |
| Egyptians | 78.3 /100 | #150 | Good 5.2% |
| Immigrants | China | 75.9 /100 | #151 | Good 5.2% |
| Immigrants | Italy | 75.0 /100 | #152 | Good 5.2% |
| Immigrants | Greece | 74.9 /100 | #153 | Good 5.2% |