Central American vs Malaysian Female Unemployment
COMPARE
Central American
Malaysian
Female Unemployment
Female Unemployment Comparison
Central Americans
Malaysians
5.9%
FEMALE UNEMPLOYMENT
0.0/ 100
METRIC RATING
271st/ 347
METRIC RANK
5.3%
FEMALE UNEMPLOYMENT
40.1/ 100
METRIC RATING
185th/ 347
METRIC RANK
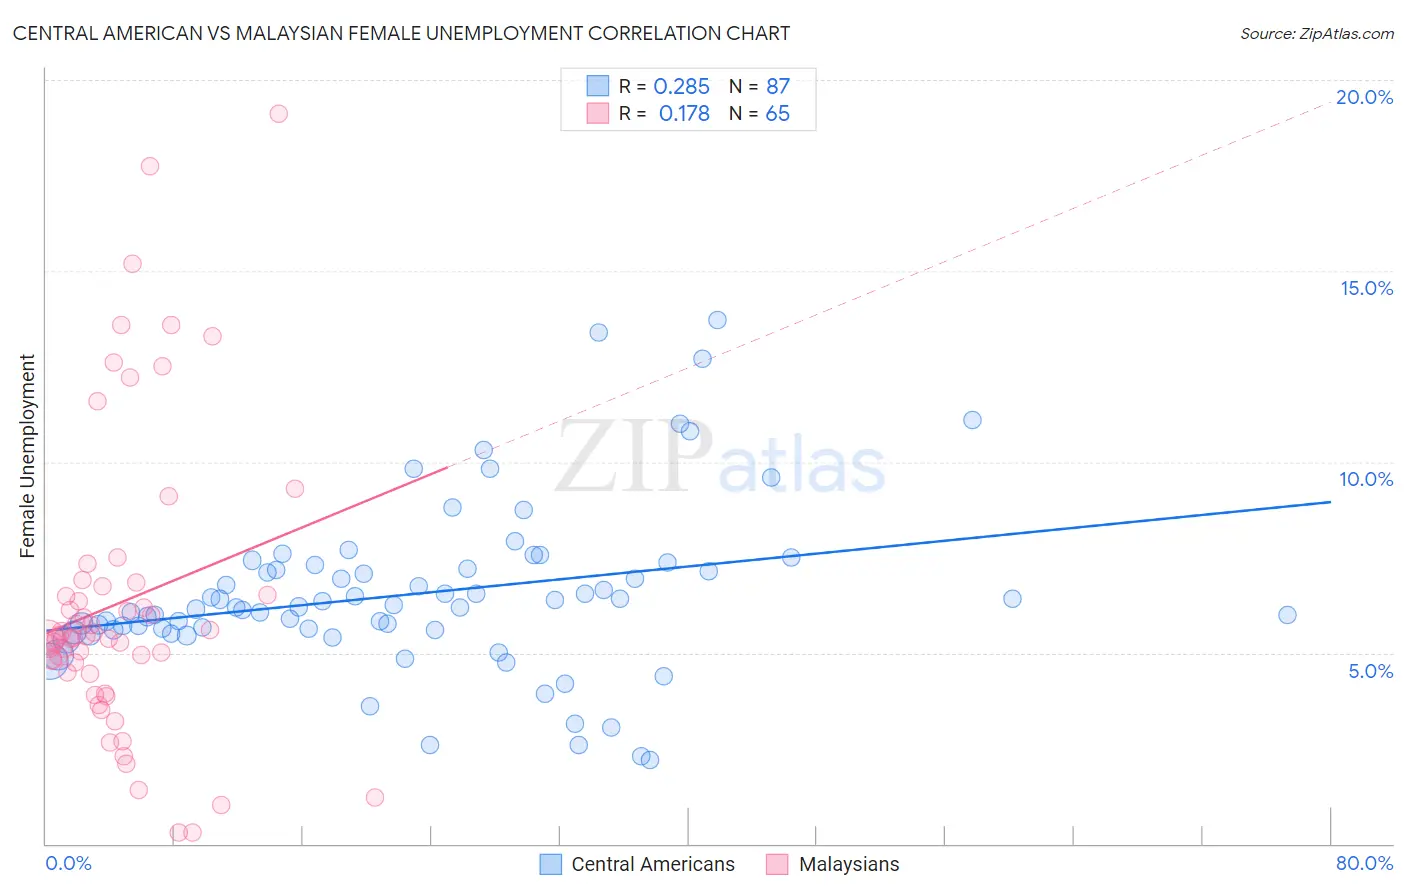
Central American vs Malaysian Female Unemployment Correlation Chart
The statistical analysis conducted on geographies consisting of 499,975,290 people shows a weak positive correlation between the proportion of Central Americans and unemploymnet rate among females in the United States with a correlation coefficient (R) of 0.285 and weighted average of 5.9%. Similarly, the statistical analysis conducted on geographies consisting of 225,706,419 people shows a poor positive correlation between the proportion of Malaysians and unemploymnet rate among females in the United States with a correlation coefficient (R) of 0.178 and weighted average of 5.3%, a difference of 12.2%.
Female Unemployment Correlation Summary
| Measurement | Central American | Malaysian |
| Minimum | 2.2% | 0.30% |
| Maximum | 13.7% | 19.1% |
| Range | 11.5% | 18.8% |
| Mean | 6.5% | 6.3% |
| Median | 6.2% | 5.4% |
| Interquartile 25% (IQ1) | 5.6% | 4.5% |
| Interquartile 75% (IQ3) | 7.2% | 6.8% |
| Interquartile Range (IQR) | 1.6% | 2.3% |
| Standard Deviation (Sample) | 2.2% | 3.9% |
| Standard Deviation (Population) | 2.2% | 3.9% |
Similar Demographics by Female Unemployment
Demographics Similar to Central Americans by Female Unemployment
In terms of female unemployment, the demographic groups most similar to Central Americans are Immigrants from Honduras (5.9%, a difference of 0.10%), Lumbee (5.9%, a difference of 0.19%), Ghanaian (5.9%, a difference of 0.20%), African (5.9%, a difference of 0.28%), and Immigrants from Western Africa (5.9%, a difference of 0.51%).
| Demographics | Rating | Rank | Female Unemployment |
| Immigrants | Bahamas | 0.1 /100 | #264 | Tragic 5.8% |
| Blackfeet | 0.0 /100 | #265 | Tragic 5.9% |
| Cape Verdeans | 0.0 /100 | #266 | Tragic 5.9% |
| Nepalese | 0.0 /100 | #267 | Tragic 5.9% |
| Hondurans | 0.0 /100 | #268 | Tragic 5.9% |
| Immigrants | Western Africa | 0.0 /100 | #269 | Tragic 5.9% |
| Immigrants | Honduras | 0.0 /100 | #270 | Tragic 5.9% |
| Central Americans | 0.0 /100 | #271 | Tragic 5.9% |
| Lumbee | 0.0 /100 | #272 | Tragic 5.9% |
| Ghanaians | 0.0 /100 | #273 | Tragic 5.9% |
| Africans | 0.0 /100 | #274 | Tragic 5.9% |
| Senegalese | 0.0 /100 | #275 | Tragic 6.0% |
| Bahamians | 0.0 /100 | #276 | Tragic 6.0% |
| Immigrants | Ghana | 0.0 /100 | #277 | Tragic 6.0% |
| Yaqui | 0.0 /100 | #278 | Tragic 6.0% |
Demographics Similar to Malaysians by Female Unemployment
In terms of female unemployment, the demographic groups most similar to Malaysians are Immigrants from Ukraine (5.3%, a difference of 0.010%), Immigrants from Indonesia (5.3%, a difference of 0.040%), Immigrants from Belarus (5.3%, a difference of 0.040%), Taiwanese (5.3%, a difference of 0.16%), and Nonimmigrants (5.3%, a difference of 0.16%).
| Demographics | Rating | Rank | Female Unemployment |
| Immigrants | Southern Europe | 46.2 /100 | #178 | Average 5.3% |
| Laotians | 45.1 /100 | #179 | Average 5.3% |
| Immigrants | Congo | 43.1 /100 | #180 | Average 5.3% |
| Taiwanese | 42.7 /100 | #181 | Average 5.3% |
| Immigrants | Nonimmigrants | 42.6 /100 | #182 | Average 5.3% |
| Immigrants | Indonesia | 40.7 /100 | #183 | Average 5.3% |
| Immigrants | Ukraine | 40.1 /100 | #184 | Average 5.3% |
| Malaysians | 40.1 /100 | #185 | Average 5.3% |
| Immigrants | Belarus | 39.4 /100 | #186 | Fair 5.3% |
| Immigrants | Albania | 35.4 /100 | #187 | Fair 5.3% |
| Afghans | 33.9 /100 | #188 | Fair 5.3% |
| Costa Ricans | 33.8 /100 | #189 | Fair 5.3% |
| Ugandans | 31.2 /100 | #190 | Fair 5.3% |
| Cherokee | 30.8 /100 | #191 | Fair 5.3% |
| Portuguese | 28.6 /100 | #192 | Fair 5.3% |