Assyrian/Chaldean/Syriac vs Immigrants from Venezuela Female Unemployment
COMPARE
Assyrian/Chaldean/Syriac
Immigrants from Venezuela
Female Unemployment
Female Unemployment Comparison
Assyrians/Chaldeans/Syriacs
Immigrants from Venezuela
5.6%
FEMALE UNEMPLOYMENT
0.8/ 100
METRIC RATING
251st/ 347
METRIC RANK
5.0%
FEMALE UNEMPLOYMENT
97.9/ 100
METRIC RATING
76th/ 347
METRIC RANK
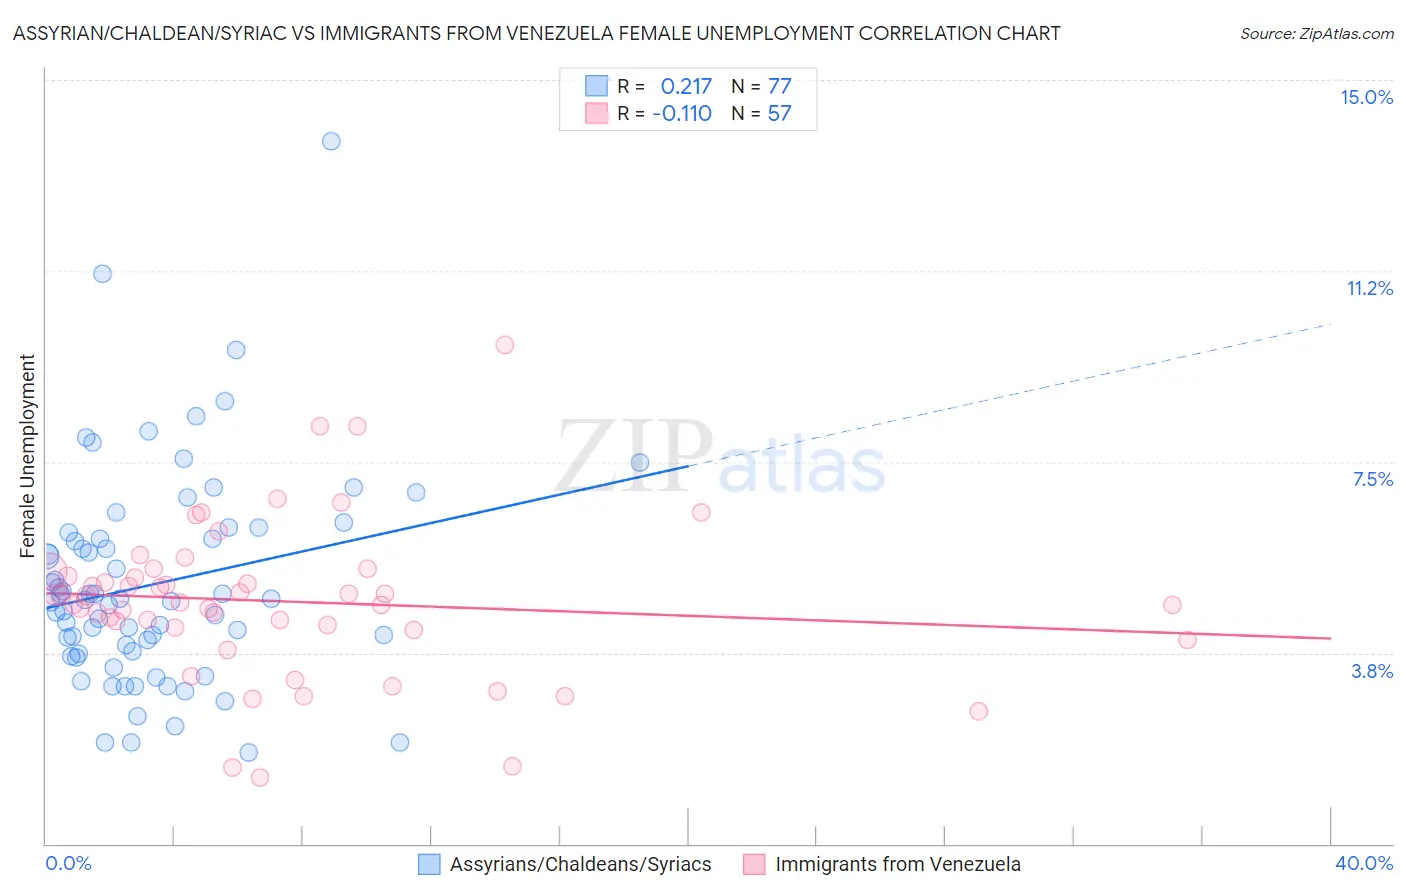
Assyrian/Chaldean/Syriac vs Immigrants from Venezuela Female Unemployment Correlation Chart
The statistical analysis conducted on geographies consisting of 110,254,844 people shows a weak positive correlation between the proportion of Assyrians/Chaldeans/Syriacs and unemploymnet rate among females in the United States with a correlation coefficient (R) of 0.217 and weighted average of 5.6%. Similarly, the statistical analysis conducted on geographies consisting of 287,321,632 people shows a poor negative correlation between the proportion of Immigrants from Venezuela and unemploymnet rate among females in the United States with a correlation coefficient (R) of -0.110 and weighted average of 5.0%, a difference of 13.9%.
Female Unemployment Correlation Summary
| Measurement | Assyrian/Chaldean/Syriac | Immigrants from Venezuela |
| Minimum | 1.8% | 1.3% |
| Maximum | 13.8% | 9.8% |
| Range | 12.0% | 8.5% |
| Mean | 5.1% | 4.8% |
| Median | 4.8% | 4.7% |
| Interquartile 25% (IQ1) | 3.8% | 4.2% |
| Interquartile 75% (IQ3) | 6.1% | 5.3% |
| Interquartile Range (IQR) | 2.3% | 1.1% |
| Standard Deviation (Sample) | 2.1% | 1.5% |
| Standard Deviation (Population) | 2.1% | 1.5% |
Similar Demographics by Female Unemployment
Demographics Similar to Assyrians/Chaldeans/Syriacs by Female Unemployment
In terms of female unemployment, the demographic groups most similar to Assyrians/Chaldeans/Syriacs are Immigrants from Syria (5.6%, a difference of 0.060%), Cajun (5.7%, a difference of 0.20%), Immigrants from Sierra Leone (5.7%, a difference of 0.34%), Immigrants (5.7%, a difference of 0.34%), and Immigrants from Uzbekistan (5.6%, a difference of 0.35%).
| Demographics | Rating | Rank | Female Unemployment |
| Immigrants | Liberia | 1.5 /100 | #244 | Tragic 5.6% |
| Guamanians/Chamorros | 1.4 /100 | #245 | Tragic 5.6% |
| Japanese | 1.2 /100 | #246 | Tragic 5.6% |
| Immigrants | Western Asia | 1.1 /100 | #247 | Tragic 5.6% |
| Cree | 1.0 /100 | #248 | Tragic 5.6% |
| Immigrants | Uzbekistan | 1.0 /100 | #249 | Tragic 5.6% |
| Immigrants | Syria | 0.8 /100 | #250 | Tragic 5.6% |
| Assyrians/Chaldeans/Syriacs | 0.8 /100 | #251 | Tragic 5.6% |
| Cajuns | 0.7 /100 | #252 | Tragic 5.7% |
| Immigrants | Sierra Leone | 0.6 /100 | #253 | Tragic 5.7% |
| Immigrants | Immigrants | 0.6 /100 | #254 | Tragic 5.7% |
| Immigrants | Cameroon | 0.6 /100 | #255 | Tragic 5.7% |
| Sub-Saharan Africans | 0.4 /100 | #256 | Tragic 5.7% |
| Dutch West Indians | 0.3 /100 | #257 | Tragic 5.7% |
| Immigrants | Portugal | 0.2 /100 | #258 | Tragic 5.8% |
Demographics Similar to Immigrants from Venezuela by Female Unemployment
In terms of female unemployment, the demographic groups most similar to Immigrants from Venezuela are Immigrants from Singapore (5.0%, a difference of 0.010%), Immigrants from Bolivia (5.0%, a difference of 0.030%), Russian (5.0%, a difference of 0.040%), Immigrants from Northern Europe (4.9%, a difference of 0.070%), and Mongolian (5.0%, a difference of 0.090%).
| Demographics | Rating | Rank | Female Unemployment |
| Immigrants | Ireland | 98.2 /100 | #69 | Exceptional 4.9% |
| Osage | 98.2 /100 | #70 | Exceptional 4.9% |
| German Russians | 98.1 /100 | #71 | Exceptional 4.9% |
| Immigrants | Northern Europe | 98.0 /100 | #72 | Exceptional 4.9% |
| Russians | 98.0 /100 | #73 | Exceptional 5.0% |
| Immigrants | Bolivia | 98.0 /100 | #74 | Exceptional 5.0% |
| Immigrants | Singapore | 98.0 /100 | #75 | Exceptional 5.0% |
| Immigrants | Venezuela | 97.9 /100 | #76 | Exceptional 5.0% |
| Mongolians | 97.8 /100 | #77 | Exceptional 5.0% |
| Immigrants | Netherlands | 97.8 /100 | #78 | Exceptional 5.0% |
| Turks | 97.6 /100 | #79 | Exceptional 5.0% |
| New Zealanders | 97.4 /100 | #80 | Exceptional 5.0% |
| Filipinos | 97.3 /100 | #81 | Exceptional 5.0% |
| Immigrants | Australia | 97.3 /100 | #82 | Exceptional 5.0% |
| Immigrants | Serbia | 97.2 /100 | #83 | Exceptional 5.0% |