Immigrants from Eastern Europe vs Immigrants from Venezuela Female Unemployment
COMPARE
Immigrants from Eastern Europe
Immigrants from Venezuela
Female Unemployment
Female Unemployment Comparison
Immigrants from Eastern Europe
Immigrants from Venezuela
5.1%
FEMALE UNEMPLOYMENT
81.5/ 100
METRIC RATING
141st/ 347
METRIC RANK
5.0%
FEMALE UNEMPLOYMENT
97.9/ 100
METRIC RATING
76th/ 347
METRIC RANK
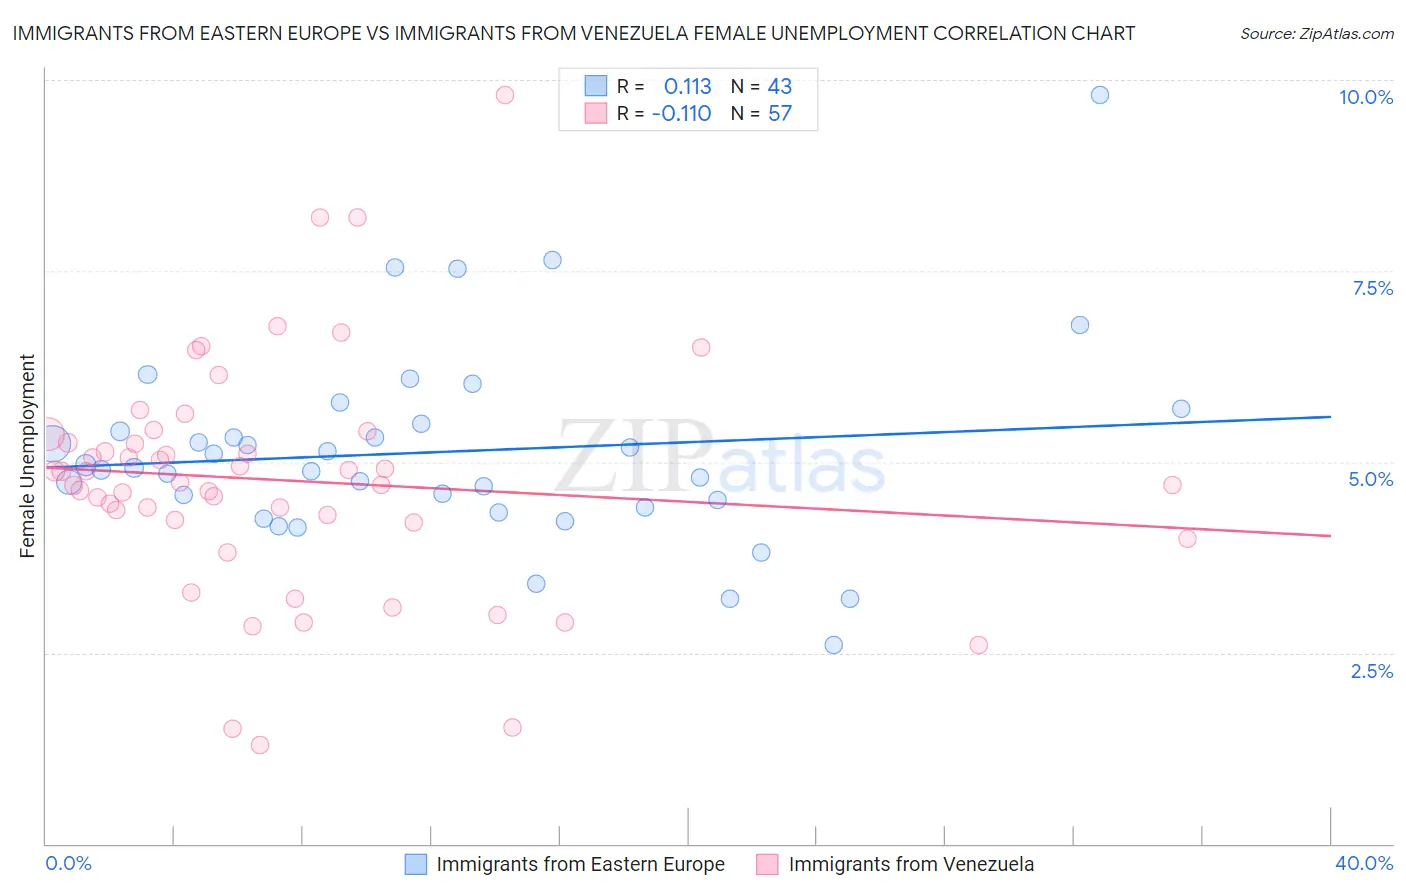
Immigrants from Eastern Europe vs Immigrants from Venezuela Female Unemployment Correlation Chart
The statistical analysis conducted on geographies consisting of 471,678,219 people shows a poor positive correlation between the proportion of Immigrants from Eastern Europe and unemploymnet rate among females in the United States with a correlation coefficient (R) of 0.113 and weighted average of 5.1%. Similarly, the statistical analysis conducted on geographies consisting of 287,321,632 people shows a poor negative correlation between the proportion of Immigrants from Venezuela and unemploymnet rate among females in the United States with a correlation coefficient (R) of -0.110 and weighted average of 5.0%, a difference of 3.8%.
Female Unemployment Correlation Summary
| Measurement | Immigrants from Eastern Europe | Immigrants from Venezuela |
| Minimum | 2.6% | 1.3% |
| Maximum | 9.8% | 9.8% |
| Range | 7.2% | 8.5% |
| Mean | 5.1% | 4.8% |
| Median | 4.9% | 4.7% |
| Interquartile 25% (IQ1) | 4.4% | 4.2% |
| Interquartile 75% (IQ3) | 5.5% | 5.3% |
| Interquartile Range (IQR) | 1.1% | 1.1% |
| Standard Deviation (Sample) | 1.3% | 1.5% |
| Standard Deviation (Population) | 1.3% | 1.5% |
Similar Demographics by Female Unemployment
Demographics Similar to Immigrants from Eastern Europe by Female Unemployment
In terms of female unemployment, the demographic groups most similar to Immigrants from Eastern Europe are Palestinian (5.1%, a difference of 0.080%), Immigrants from Kazakhstan (5.1%, a difference of 0.090%), Immigrants from Jordan (5.1%, a difference of 0.11%), Immigrants from France (5.1%, a difference of 0.12%), and Immigrants from Eastern Asia (5.1%, a difference of 0.16%).
| Demographics | Rating | Rank | Female Unemployment |
| Immigrants | Eritrea | 84.6 /100 | #134 | Excellent 5.1% |
| Immigrants | Latvia | 84.6 /100 | #135 | Excellent 5.1% |
| Indians (Asian) | 84.2 /100 | #136 | Excellent 5.1% |
| Pakistanis | 83.8 /100 | #137 | Excellent 5.1% |
| Chickasaw | 83.2 /100 | #138 | Excellent 5.1% |
| Immigrants | Eastern Asia | 83.0 /100 | #139 | Excellent 5.1% |
| Immigrants | France | 82.7 /100 | #140 | Excellent 5.1% |
| Immigrants | Eastern Europe | 81.5 /100 | #141 | Excellent 5.1% |
| Palestinians | 80.8 /100 | #142 | Excellent 5.1% |
| Immigrants | Kazakhstan | 80.7 /100 | #143 | Excellent 5.1% |
| Immigrants | Jordan | 80.4 /100 | #144 | Excellent 5.1% |
| Immigrants | Oceania | 79.5 /100 | #145 | Good 5.2% |
| Immigrants | Norway | 79.4 /100 | #146 | Good 5.2% |
| Argentineans | 79.2 /100 | #147 | Good 5.2% |
| Immigrants | Argentina | 78.7 /100 | #148 | Good 5.2% |
Demographics Similar to Immigrants from Venezuela by Female Unemployment
In terms of female unemployment, the demographic groups most similar to Immigrants from Venezuela are Immigrants from Singapore (5.0%, a difference of 0.010%), Immigrants from Bolivia (5.0%, a difference of 0.030%), Russian (5.0%, a difference of 0.040%), Immigrants from Northern Europe (4.9%, a difference of 0.070%), and Mongolian (5.0%, a difference of 0.090%).
| Demographics | Rating | Rank | Female Unemployment |
| Immigrants | Ireland | 98.2 /100 | #69 | Exceptional 4.9% |
| Osage | 98.2 /100 | #70 | Exceptional 4.9% |
| German Russians | 98.1 /100 | #71 | Exceptional 4.9% |
| Immigrants | Northern Europe | 98.0 /100 | #72 | Exceptional 4.9% |
| Russians | 98.0 /100 | #73 | Exceptional 5.0% |
| Immigrants | Bolivia | 98.0 /100 | #74 | Exceptional 5.0% |
| Immigrants | Singapore | 98.0 /100 | #75 | Exceptional 5.0% |
| Immigrants | Venezuela | 97.9 /100 | #76 | Exceptional 5.0% |
| Mongolians | 97.8 /100 | #77 | Exceptional 5.0% |
| Immigrants | Netherlands | 97.8 /100 | #78 | Exceptional 5.0% |
| Turks | 97.6 /100 | #79 | Exceptional 5.0% |
| New Zealanders | 97.4 /100 | #80 | Exceptional 5.0% |
| Filipinos | 97.3 /100 | #81 | Exceptional 5.0% |
| Immigrants | Australia | 97.3 /100 | #82 | Exceptional 5.0% |
| Immigrants | Serbia | 97.2 /100 | #83 | Exceptional 5.0% |