Portuguese vs Hispanic or Latino Unemployment Among Women with Children Ages 6 to 17 years
COMPARE
Portuguese
Hispanic or Latino
Unemployment Among Women with Children Ages 6 to 17 years
Unemployment Among Women with Children Ages 6 to 17 years Comparison
Portuguese
Hispanics or Latinos
9.4%
UNEMPLOYMENT AMONG WOMEN WITH CHILDREN AGES 6 TO 17 YEARS
1.1/ 100
METRIC RATING
253rd/ 347
METRIC RANK
9.9%
UNEMPLOYMENT AMONG WOMEN WITH CHILDREN AGES 6 TO 17 YEARS
0.0/ 100
METRIC RATING
285th/ 347
METRIC RANK
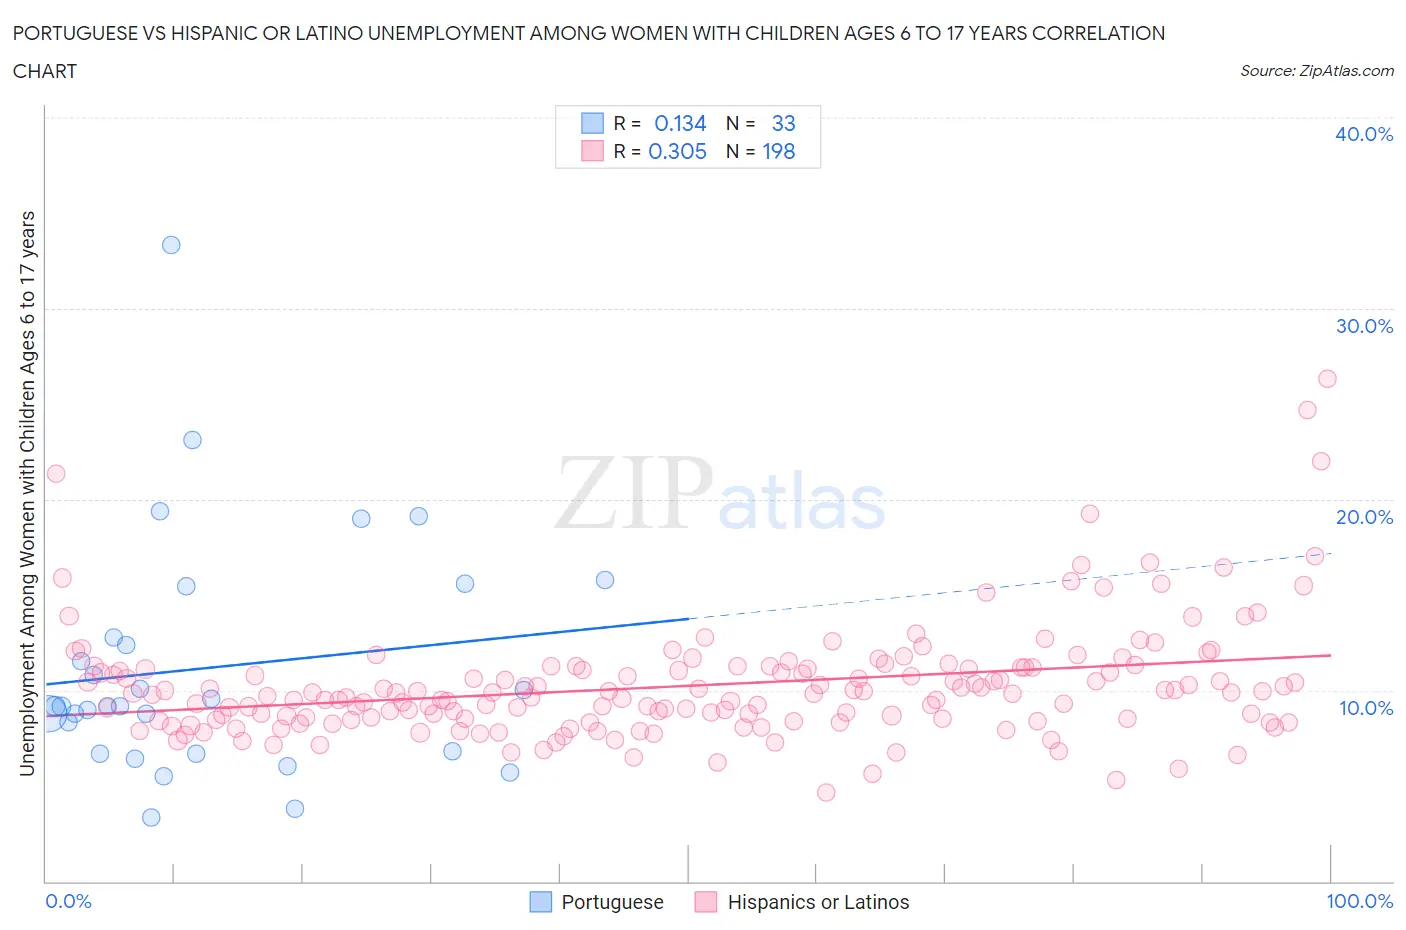
Portuguese vs Hispanic or Latino Unemployment Among Women with Children Ages 6 to 17 years Correlation Chart
The statistical analysis conducted on geographies consisting of 310,563,323 people shows a poor positive correlation between the proportion of Portuguese and unemployment rate among women with children between the ages 6 and 17 in the United States with a correlation coefficient (R) of 0.134 and weighted average of 9.4%. Similarly, the statistical analysis conducted on geographies consisting of 359,612,346 people shows a mild positive correlation between the proportion of Hispanics or Latinos and unemployment rate among women with children between the ages 6 and 17 in the United States with a correlation coefficient (R) of 0.305 and weighted average of 9.9%, a difference of 5.4%.
Unemployment Among Women with Children Ages 6 to 17 years Correlation Summary
| Measurement | Portuguese | Hispanic or Latino |
| Minimum | 3.3% | 4.6% |
| Maximum | 33.4% | 26.3% |
| Range | 30.0% | 21.7% |
| Mean | 11.2% | 10.2% |
| Median | 9.2% | 9.8% |
| Interquartile 25% (IQ1) | 6.8% | 8.4% |
| Interquartile 75% (IQ3) | 14.1% | 11.2% |
| Interquartile Range (IQR) | 7.4% | 2.7% |
| Standard Deviation (Sample) | 6.2% | 3.0% |
| Standard Deviation (Population) | 6.1% | 3.0% |
Similar Demographics by Unemployment Among Women with Children Ages 6 to 17 years
Demographics Similar to Portuguese by Unemployment Among Women with Children Ages 6 to 17 years
In terms of unemployment among women with children ages 6 to 17 years, the demographic groups most similar to Portuguese are Creek (9.4%, a difference of 0.090%), Nicaraguan (9.4%, a difference of 0.17%), Central American (9.4%, a difference of 0.18%), Immigrants from Guatemala (9.4%, a difference of 0.20%), and Lithuanian (9.4%, a difference of 0.23%).
| Demographics | Rating | Rank | Unemployment Among Women with Children Ages 6 to 17 years |
| Immigrants | Africa | 1.6 /100 | #246 | Tragic 9.4% |
| Poles | 1.5 /100 | #247 | Tragic 9.4% |
| Dutch | 1.5 /100 | #248 | Tragic 9.4% |
| Immigrants | South America | 1.5 /100 | #249 | Tragic 9.4% |
| Immigrants | Guatemala | 1.3 /100 | #250 | Tragic 9.4% |
| Central Americans | 1.3 /100 | #251 | Tragic 9.4% |
| Creek | 1.2 /100 | #252 | Tragic 9.4% |
| Portuguese | 1.1 /100 | #253 | Tragic 9.4% |
| Nicaraguans | 1.0 /100 | #254 | Tragic 9.4% |
| Lithuanians | 0.9 /100 | #255 | Tragic 9.4% |
| Canadians | 0.8 /100 | #256 | Tragic 9.4% |
| Celtics | 0.7 /100 | #257 | Tragic 9.5% |
| Immigrants | Mexico | 0.7 /100 | #258 | Tragic 9.5% |
| Immigrants | Central America | 0.6 /100 | #259 | Tragic 9.5% |
| Italians | 0.6 /100 | #260 | Tragic 9.5% |
Demographics Similar to Hispanics or Latinos by Unemployment Among Women with Children Ages 6 to 17 years
In terms of unemployment among women with children ages 6 to 17 years, the demographic groups most similar to Hispanics or Latinos are Choctaw (9.9%, a difference of 0.12%), Sierra Leonean (9.9%, a difference of 0.16%), Yakama (9.9%, a difference of 0.31%), Shoshone (10.0%, a difference of 0.41%), and Central American Indian (9.9%, a difference of 0.46%).
| Demographics | Rating | Rank | Unemployment Among Women with Children Ages 6 to 17 years |
| French | 0.1 /100 | #278 | Tragic 9.7% |
| Scotch-Irish | 0.1 /100 | #279 | Tragic 9.7% |
| Seminole | 0.1 /100 | #280 | Tragic 9.7% |
| Jamaicans | 0.0 /100 | #281 | Tragic 9.8% |
| Slovaks | 0.0 /100 | #282 | Tragic 9.8% |
| Central American Indians | 0.0 /100 | #283 | Tragic 9.9% |
| Yakama | 0.0 /100 | #284 | Tragic 9.9% |
| Hispanics or Latinos | 0.0 /100 | #285 | Tragic 9.9% |
| Choctaw | 0.0 /100 | #286 | Tragic 9.9% |
| Sierra Leoneans | 0.0 /100 | #287 | Tragic 9.9% |
| Shoshone | 0.0 /100 | #288 | Tragic 10.0% |
| Hondurans | 0.0 /100 | #289 | Tragic 10.0% |
| Sub-Saharan Africans | 0.0 /100 | #290 | Tragic 10.0% |
| Immigrants | Nonimmigrants | 0.0 /100 | #291 | Tragic 10.0% |
| Carpatho Rusyns | 0.0 /100 | #292 | Tragic 10.0% |