Portuguese vs Hispanic or Latino Unemployment Among Women with Children Under 18 years
COMPARE
Portuguese
Hispanic or Latino
Unemployment Among Women with Children Under 18 years
Unemployment Among Women with Children Under 18 years Comparison
Portuguese
Hispanics or Latinos
5.6%
UNEMPLOYMENT AMONG WOMEN WITH CHILDREN UNDER 18 YEARS
15.9/ 100
METRIC RATING
203rd/ 347
METRIC RANK
6.6%
UNEMPLOYMENT AMONG WOMEN WITH CHILDREN UNDER 18 YEARS
0.0/ 100
METRIC RATING
313th/ 347
METRIC RANK
Portuguese vs Hispanic or Latino Unemployment Among Women with Children Under 18 years Correlation Chart
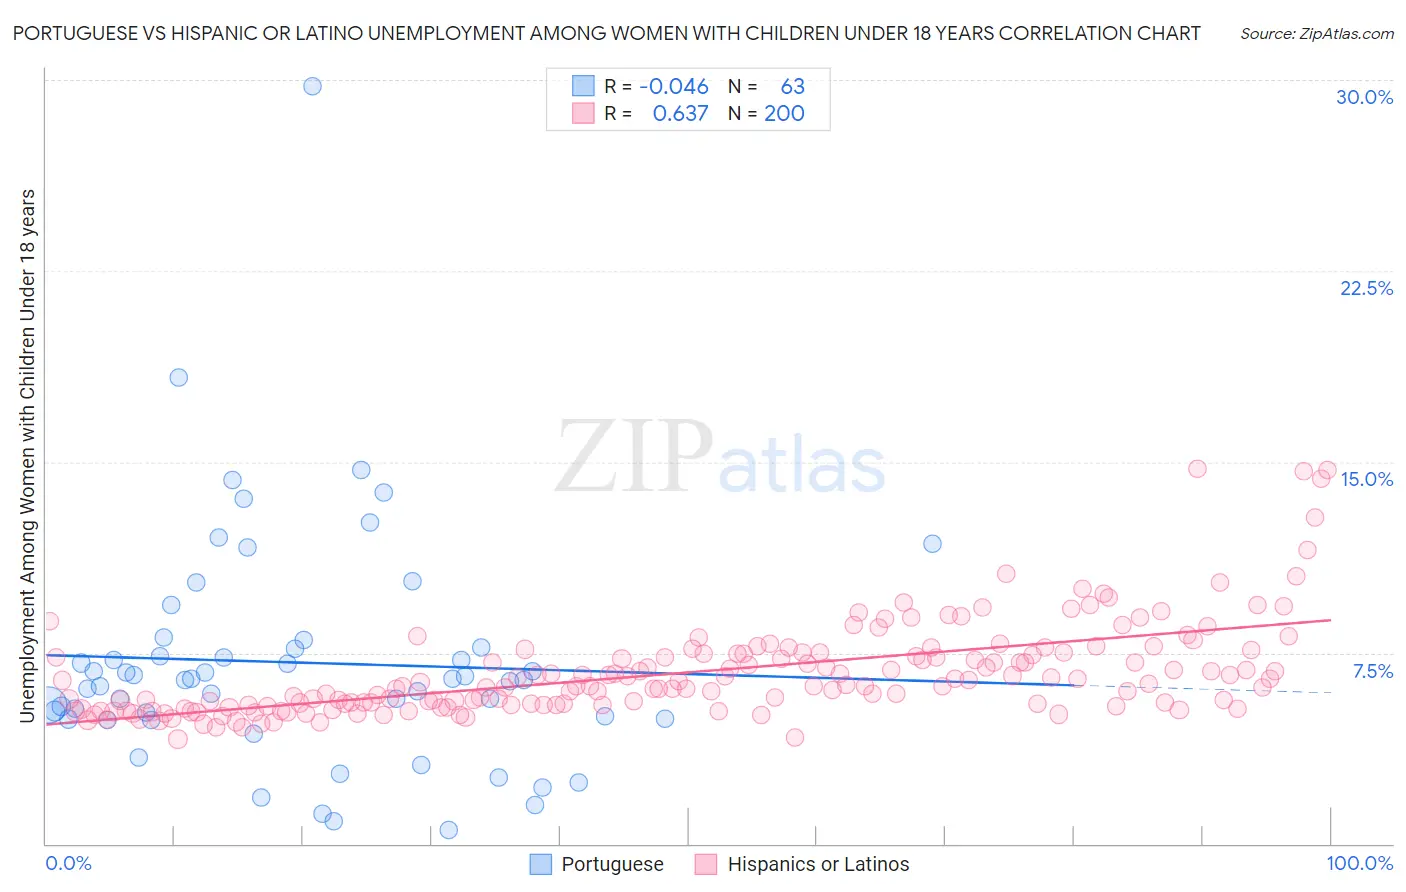
The statistical analysis conducted on geographies consisting of 426,366,108 people shows no correlation between the proportion of Portuguese and unemployment rate among women with children under the age of 18 in the United States with a correlation coefficient (R) of -0.046 and weighted average of 5.6%. Similarly, the statistical analysis conducted on geographies consisting of 521,591,164 people shows a significant positive correlation between the proportion of Hispanics or Latinos and unemployment rate among women with children under the age of 18 in the United States with a correlation coefficient (R) of 0.637 and weighted average of 6.6%, a difference of 17.7%.
Unemployment Among Women with Children Under 18 years Correlation Summary
| Measurement | Portuguese | Hispanic or Latino |
| Minimum | 0.54% | 4.1% |
| Maximum | 29.7% | 14.7% |
| Range | 29.2% | 10.6% |
| Mean | 7.1% | 6.7% |
| Median | 6.4% | 6.2% |
| Interquartile 25% (IQ1) | 4.9% | 5.4% |
| Interquartile 75% (IQ3) | 7.7% | 7.5% |
| Interquartile Range (IQR) | 2.8% | 2.0% |
| Standard Deviation (Sample) | 4.6% | 1.9% |
| Standard Deviation (Population) | 4.6% | 1.9% |
Similar Demographics by Unemployment Among Women with Children Under 18 years
Demographics Similar to Portuguese by Unemployment Among Women with Children Under 18 years
In terms of unemployment among women with children under 18 years, the demographic groups most similar to Portuguese are Israeli (5.6%, a difference of 0.030%), Tsimshian (5.6%, a difference of 0.080%), Immigrants from Micronesia (5.6%, a difference of 0.15%), Immigrants from Morocco (5.6%, a difference of 0.24%), and Menominee (5.6%, a difference of 0.33%).
| Demographics | Rating | Rank | Unemployment Among Women with Children Under 18 years |
| Spaniards | 22.8 /100 | #196 | Fair 5.6% |
| Immigrants | Colombia | 21.4 /100 | #197 | Fair 5.6% |
| Arabs | 21.4 /100 | #198 | Fair 5.6% |
| Marshallese | 20.2 /100 | #199 | Fair 5.6% |
| Menominee | 18.6 /100 | #200 | Poor 5.6% |
| Immigrants | Morocco | 17.9 /100 | #201 | Poor 5.6% |
| Immigrants | Micronesia | 17.1 /100 | #202 | Poor 5.6% |
| Portuguese | 15.9 /100 | #203 | Poor 5.6% |
| Israelis | 15.6 /100 | #204 | Poor 5.6% |
| Tsimshian | 15.2 /100 | #205 | Poor 5.6% |
| Nicaraguans | 12.3 /100 | #206 | Poor 5.6% |
| Peruvians | 12.1 /100 | #207 | Poor 5.6% |
| Immigrants | Costa Rica | 11.6 /100 | #208 | Poor 5.6% |
| Immigrants | Western Asia | 11.3 /100 | #209 | Poor 5.6% |
| Immigrants | Nonimmigrants | 10.6 /100 | #210 | Poor 5.7% |
Demographics Similar to Hispanics or Latinos by Unemployment Among Women with Children Under 18 years
In terms of unemployment among women with children under 18 years, the demographic groups most similar to Hispanics or Latinos are British West Indian (6.6%, a difference of 0.14%), Immigrants from West Indies (6.6%, a difference of 0.14%), Immigrants from Mexico (6.6%, a difference of 0.29%), Yaqui (6.6%, a difference of 0.38%), and Immigrants from Ecuador (6.6%, a difference of 0.48%).
| Demographics | Rating | Rank | Unemployment Among Women with Children Under 18 years |
| Immigrants | Guyana | 0.0 /100 | #306 | Tragic 6.5% |
| Belizeans | 0.0 /100 | #307 | Tragic 6.5% |
| Africans | 0.0 /100 | #308 | Tragic 6.5% |
| Ecuadorians | 0.0 /100 | #309 | Tragic 6.5% |
| Guyanese | 0.0 /100 | #310 | Tragic 6.6% |
| Yaqui | 0.0 /100 | #311 | Tragic 6.6% |
| Immigrants | Mexico | 0.0 /100 | #312 | Tragic 6.6% |
| Hispanics or Latinos | 0.0 /100 | #313 | Tragic 6.6% |
| British West Indians | 0.0 /100 | #314 | Tragic 6.6% |
| Immigrants | West Indies | 0.0 /100 | #315 | Tragic 6.6% |
| Immigrants | Ecuador | 0.0 /100 | #316 | Tragic 6.6% |
| Shoshone | 0.0 /100 | #317 | Tragic 6.6% |
| Alaska Natives | 0.0 /100 | #318 | Tragic 6.7% |
| Central American Indians | 0.0 /100 | #319 | Tragic 6.7% |
| Immigrants | Belize | 0.0 /100 | #320 | Tragic 6.7% |