Immigrants from Hungary vs Osage Unemployment
COMPARE
Immigrants from Hungary
Osage
Unemployment
Unemployment Comparison
Immigrants from Hungary
Osage
5.1%
UNEMPLOYMENT
85.6/ 100
METRIC RATING
138th/ 347
METRIC RANK
5.0%
UNEMPLOYMENT
94.0/ 100
METRIC RATING
104th/ 347
METRIC RANK
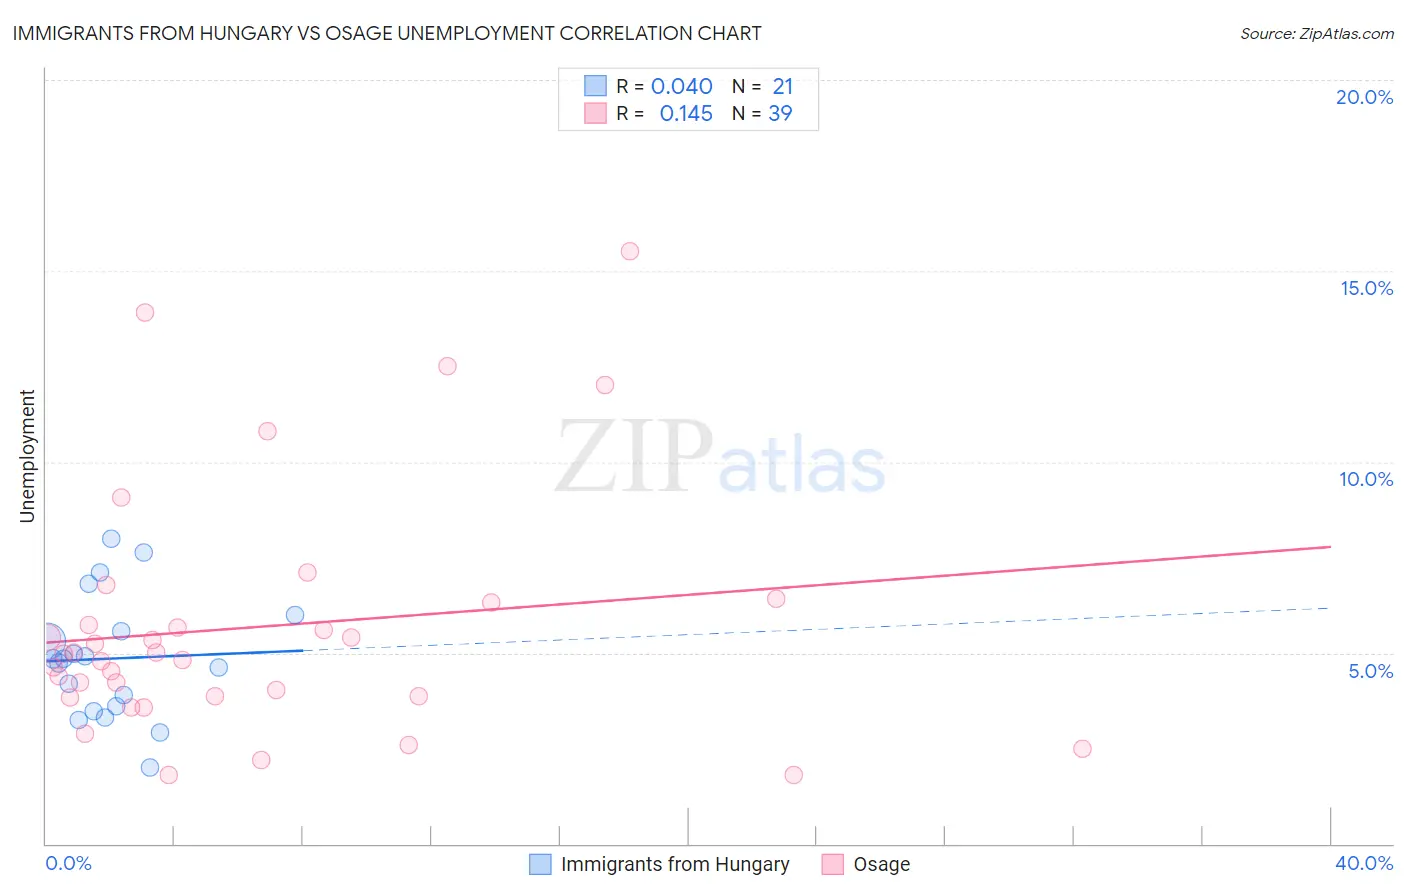
Immigrants from Hungary vs Osage Unemployment Correlation Chart
The statistical analysis conducted on geographies consisting of 195,624,152 people shows no correlation between the proportion of Immigrants from Hungary and unemployment in the United States with a correlation coefficient (R) of 0.040 and weighted average of 5.1%. Similarly, the statistical analysis conducted on geographies consisting of 91,752,041 people shows a poor positive correlation between the proportion of Osage and unemployment in the United States with a correlation coefficient (R) of 0.145 and weighted average of 5.0%, a difference of 1.5%.
Unemployment Correlation Summary
| Measurement | Immigrants from Hungary | Osage |
| Minimum | 2.0% | 1.8% |
| Maximum | 8.0% | 15.5% |
| Range | 6.0% | 13.7% |
| Mean | 4.9% | 5.7% |
| Median | 4.8% | 5.0% |
| Interquartile 25% (IQ1) | 3.5% | 3.9% |
| Interquartile 75% (IQ3) | 5.8% | 6.3% |
| Interquartile Range (IQR) | 2.2% | 2.5% |
| Standard Deviation (Sample) | 1.6% | 3.2% |
| Standard Deviation (Population) | 1.5% | 3.2% |
Similar Demographics by Unemployment
Demographics Similar to Immigrants from Hungary by Unemployment
In terms of unemployment, the demographic groups most similar to Immigrants from Hungary are Immigrants from Saudi Arabia (5.1%, a difference of 0.010%), Pakistani (5.1%, a difference of 0.040%), Immigrants from Burma/Myanmar (5.1%, a difference of 0.080%), Immigrants from Spain (5.1%, a difference of 0.080%), and Immigrants from Europe (5.1%, a difference of 0.090%).
| Demographics | Rating | Rank | Unemployment |
| Immigrants | Croatia | 86.8 /100 | #131 | Excellent 5.1% |
| Immigrants | Ethiopia | 86.7 /100 | #132 | Excellent 5.1% |
| Immigrants | Jordan | 86.6 /100 | #133 | Excellent 5.1% |
| Immigrants | Europe | 86.3 /100 | #134 | Excellent 5.1% |
| Immigrants | Burma/Myanmar | 86.2 /100 | #135 | Excellent 5.1% |
| Immigrants | Spain | 86.2 /100 | #136 | Excellent 5.1% |
| Immigrants | Saudi Arabia | 85.6 /100 | #137 | Excellent 5.1% |
| Immigrants | Hungary | 85.6 /100 | #138 | Excellent 5.1% |
| Pakistanis | 85.3 /100 | #139 | Excellent 5.1% |
| Immigrants | Denmark | 84.3 /100 | #140 | Excellent 5.1% |
| Palestinians | 83.4 /100 | #141 | Excellent 5.1% |
| Immigrants | Pakistan | 83.2 /100 | #142 | Excellent 5.1% |
| Immigrants | Chile | 82.8 /100 | #143 | Excellent 5.1% |
| Indonesians | 82.3 /100 | #144 | Excellent 5.1% |
| Immigrants | Norway | 81.8 /100 | #145 | Excellent 5.1% |
Demographics Similar to Osage by Unemployment
In terms of unemployment, the demographic groups most similar to Osage are Chickasaw (5.0%, a difference of 0.0%), Maltese (5.0%, a difference of 0.0%), Immigrants from Argentina (5.0%, a difference of 0.040%), Immigrants from Romania (5.0%, a difference of 0.070%), and American (5.0%, a difference of 0.080%).
| Demographics | Rating | Rank | Unemployment |
| Immigrants | Czechoslovakia | 95.1 /100 | #97 | Exceptional 5.0% |
| Romanians | 95.0 /100 | #98 | Exceptional 5.0% |
| Mongolians | 94.8 /100 | #99 | Exceptional 5.0% |
| Estonians | 94.6 /100 | #100 | Exceptional 5.0% |
| Americans | 94.3 /100 | #101 | Exceptional 5.0% |
| Immigrants | Argentina | 94.1 /100 | #102 | Exceptional 5.0% |
| Chickasaw | 94.0 /100 | #103 | Exceptional 5.0% |
| Osage | 94.0 /100 | #104 | Exceptional 5.0% |
| Maltese | 94.0 /100 | #105 | Exceptional 5.0% |
| Immigrants | Romania | 93.7 /100 | #106 | Exceptional 5.0% |
| Immigrants | Turkey | 93.7 /100 | #107 | Exceptional 5.0% |
| Immigrants | Kuwait | 93.7 /100 | #108 | Exceptional 5.0% |
| Immigrants | Eritrea | 93.3 /100 | #109 | Exceptional 5.0% |
| Immigrants | Lithuania | 93.2 /100 | #110 | Exceptional 5.0% |
| Chileans | 93.2 /100 | #111 | Exceptional 5.0% |