Dutch vs Osage Unemployment
COMPARE
Dutch
Osage
Unemployment
Unemployment Comparison
Dutch
Osage
4.6%
UNEMPLOYMENT
100.0/ 100
METRIC RATING
10th/ 347
METRIC RANK
5.0%
UNEMPLOYMENT
94.0/ 100
METRIC RATING
104th/ 347
METRIC RANK
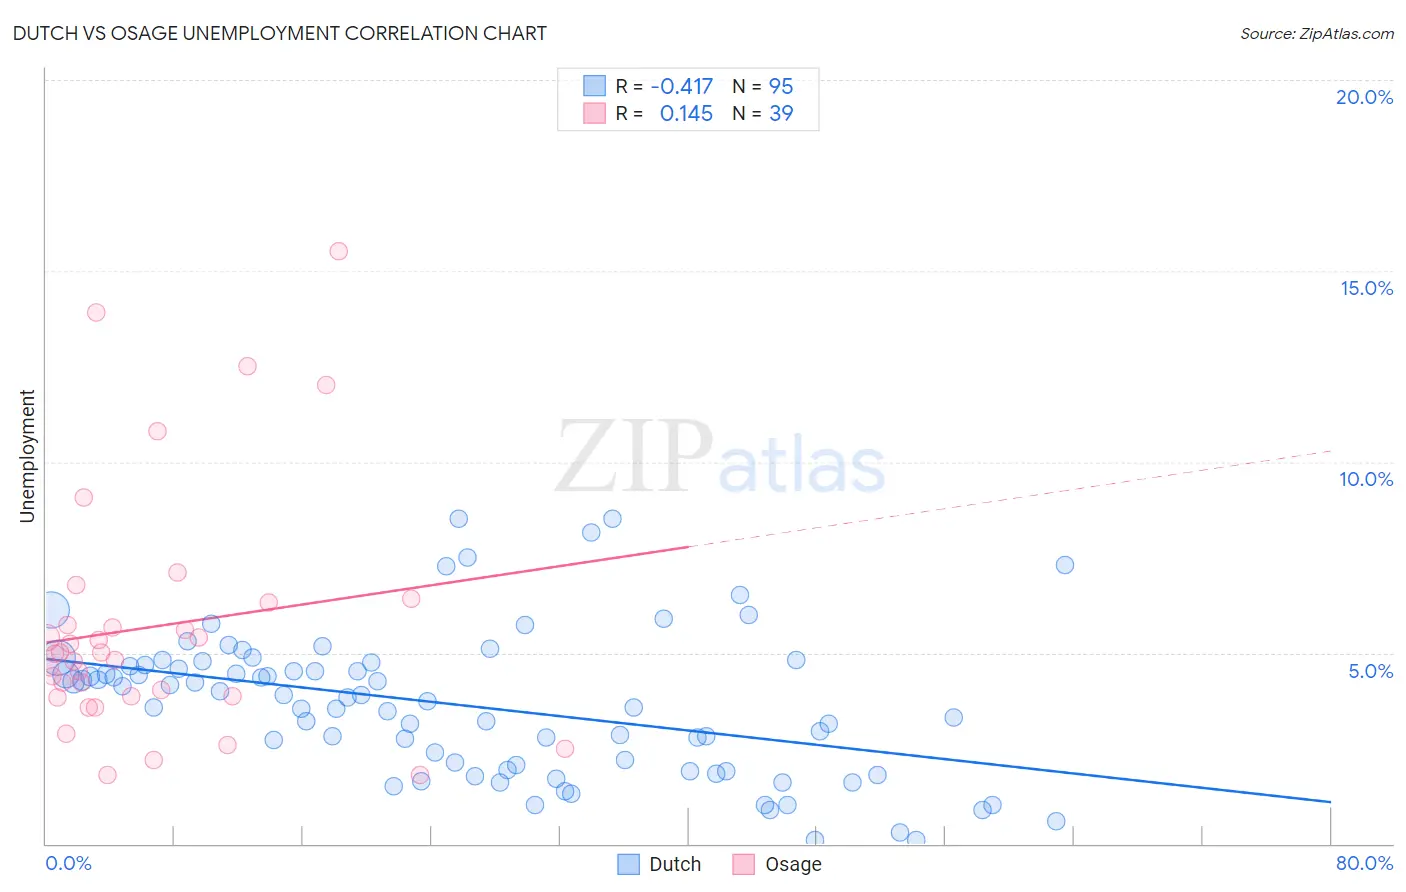
Dutch vs Osage Unemployment Correlation Chart
The statistical analysis conducted on geographies consisting of 551,058,238 people shows a moderate negative correlation between the proportion of Dutch and unemployment in the United States with a correlation coefficient (R) of -0.417 and weighted average of 4.6%. Similarly, the statistical analysis conducted on geographies consisting of 91,752,041 people shows a poor positive correlation between the proportion of Osage and unemployment in the United States with a correlation coefficient (R) of 0.145 and weighted average of 5.0%, a difference of 10.2%.
Unemployment Correlation Summary
| Measurement | Dutch | Osage |
| Minimum | 0.10% | 1.8% |
| Maximum | 8.5% | 15.5% |
| Range | 8.4% | 13.7% |
| Mean | 3.6% | 5.7% |
| Median | 3.8% | 5.0% |
| Interquartile 25% (IQ1) | 1.9% | 3.9% |
| Interquartile 75% (IQ3) | 4.7% | 6.3% |
| Interquartile Range (IQR) | 2.8% | 2.5% |
| Standard Deviation (Sample) | 1.9% | 3.2% |
| Standard Deviation (Population) | 1.9% | 3.2% |
Similar Demographics by Unemployment
Demographics Similar to Dutch by Unemployment
In terms of unemployment, the demographic groups most similar to Dutch are Scandinavian (4.5%, a difference of 0.51%), English (4.6%, a difference of 0.66%), Pennsylvania German (4.6%, a difference of 0.76%), Swiss (4.5%, a difference of 0.90%), and Belgian (4.6%, a difference of 0.93%).
| Demographics | Rating | Rank | Unemployment |
| Czechs | 100.0 /100 | #3 | Exceptional 4.3% |
| Danes | 100.0 /100 | #4 | Exceptional 4.3% |
| Swedes | 100.0 /100 | #5 | Exceptional 4.4% |
| Germans | 100.0 /100 | #6 | Exceptional 4.5% |
| Immigrants | India | 100.0 /100 | #7 | Exceptional 4.5% |
| Swiss | 100.0 /100 | #8 | Exceptional 4.5% |
| Scandinavians | 100.0 /100 | #9 | Exceptional 4.5% |
| Dutch | 100.0 /100 | #10 | Exceptional 4.6% |
| English | 100.0 /100 | #11 | Exceptional 4.6% |
| Pennsylvania Germans | 100.0 /100 | #12 | Exceptional 4.6% |
| Belgians | 100.0 /100 | #13 | Exceptional 4.6% |
| Immigrants | Cuba | 100.0 /100 | #14 | Exceptional 4.6% |
| Europeans | 99.9 /100 | #15 | Exceptional 4.6% |
| Chinese | 99.9 /100 | #16 | Exceptional 4.7% |
| Slovenes | 99.9 /100 | #17 | Exceptional 4.7% |
Demographics Similar to Osage by Unemployment
In terms of unemployment, the demographic groups most similar to Osage are Chickasaw (5.0%, a difference of 0.0%), Maltese (5.0%, a difference of 0.0%), Immigrants from Argentina (5.0%, a difference of 0.040%), Immigrants from Romania (5.0%, a difference of 0.070%), and American (5.0%, a difference of 0.080%).
| Demographics | Rating | Rank | Unemployment |
| Immigrants | Czechoslovakia | 95.1 /100 | #97 | Exceptional 5.0% |
| Romanians | 95.0 /100 | #98 | Exceptional 5.0% |
| Mongolians | 94.8 /100 | #99 | Exceptional 5.0% |
| Estonians | 94.6 /100 | #100 | Exceptional 5.0% |
| Americans | 94.3 /100 | #101 | Exceptional 5.0% |
| Immigrants | Argentina | 94.1 /100 | #102 | Exceptional 5.0% |
| Chickasaw | 94.0 /100 | #103 | Exceptional 5.0% |
| Osage | 94.0 /100 | #104 | Exceptional 5.0% |
| Maltese | 94.0 /100 | #105 | Exceptional 5.0% |
| Immigrants | Romania | 93.7 /100 | #106 | Exceptional 5.0% |
| Immigrants | Turkey | 93.7 /100 | #107 | Exceptional 5.0% |
| Immigrants | Kuwait | 93.7 /100 | #108 | Exceptional 5.0% |
| Immigrants | Eritrea | 93.3 /100 | #109 | Exceptional 5.0% |
| Immigrants | Lithuania | 93.2 /100 | #110 | Exceptional 5.0% |
| Chileans | 93.2 /100 | #111 | Exceptional 5.0% |