Central American vs Osage Unemployment
COMPARE
Central American
Osage
Unemployment
Unemployment Comparison
Central Americans
Osage
5.7%
UNEMPLOYMENT
0.3/ 100
METRIC RATING
253rd/ 347
METRIC RANK
5.0%
UNEMPLOYMENT
94.0/ 100
METRIC RATING
104th/ 347
METRIC RANK
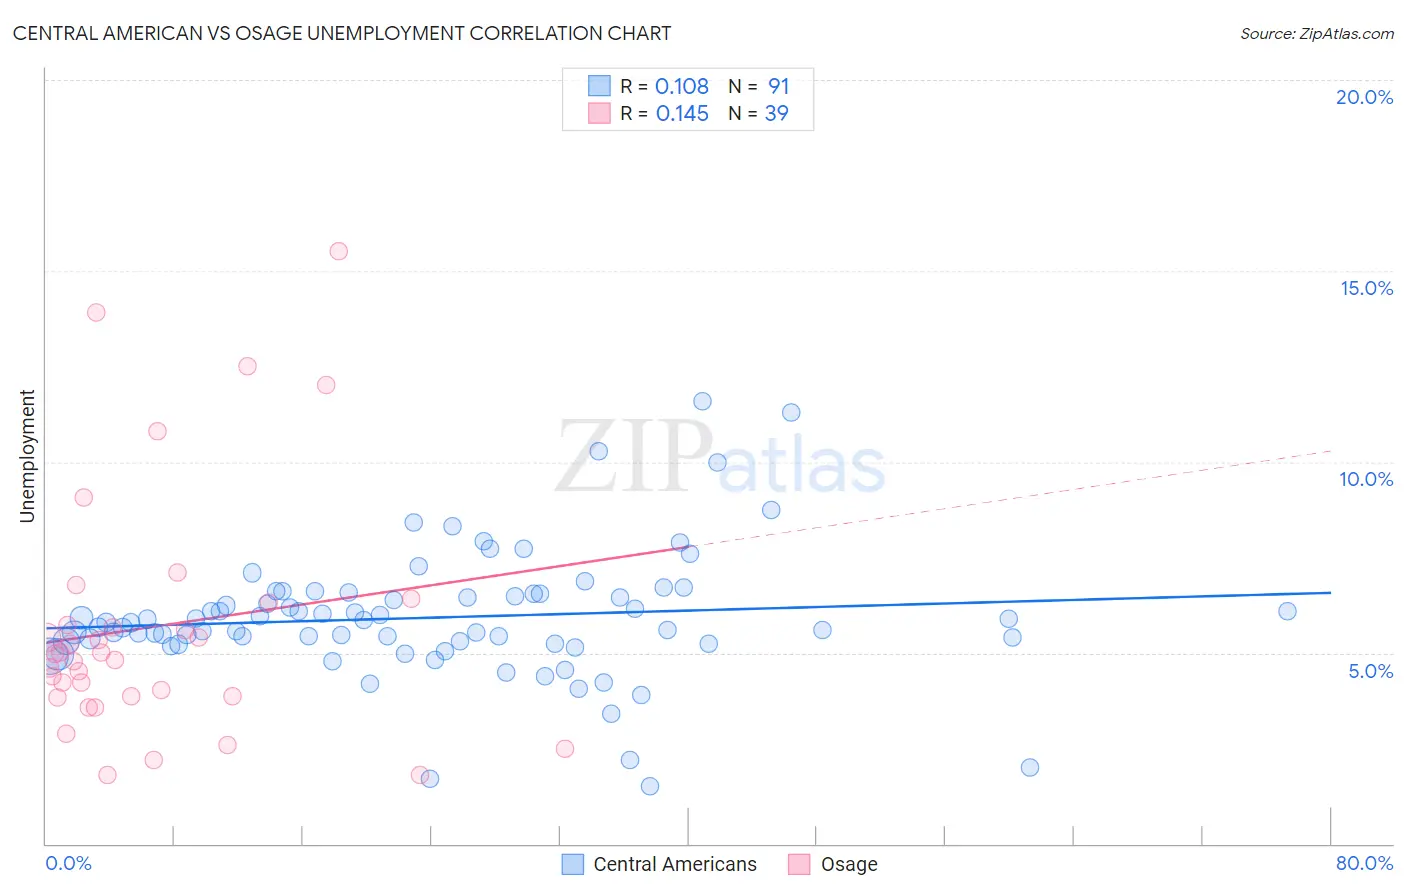
Central American vs Osage Unemployment Correlation Chart
The statistical analysis conducted on geographies consisting of 503,567,641 people shows a poor positive correlation between the proportion of Central Americans and unemployment in the United States with a correlation coefficient (R) of 0.108 and weighted average of 5.7%. Similarly, the statistical analysis conducted on geographies consisting of 91,752,041 people shows a poor positive correlation between the proportion of Osage and unemployment in the United States with a correlation coefficient (R) of 0.145 and weighted average of 5.0%, a difference of 13.6%.
Unemployment Correlation Summary
| Measurement | Central American | Osage |
| Minimum | 1.5% | 1.8% |
| Maximum | 11.6% | 15.5% |
| Range | 10.1% | 13.7% |
| Mean | 5.9% | 5.7% |
| Median | 5.8% | 5.0% |
| Interquartile 25% (IQ1) | 5.3% | 3.9% |
| Interquartile 75% (IQ3) | 6.5% | 6.3% |
| Interquartile Range (IQR) | 1.3% | 2.5% |
| Standard Deviation (Sample) | 1.7% | 3.2% |
| Standard Deviation (Population) | 1.7% | 3.2% |
Similar Demographics by Unemployment
Demographics Similar to Central Americans by Unemployment
In terms of unemployment, the demographic groups most similar to Central Americans are Honduran (5.7%, a difference of 0.010%), Immigrants from Honduras (5.7%, a difference of 0.070%), Immigrants from Portugal (5.7%, a difference of 0.52%), Guatemalan (5.8%, a difference of 0.72%), and Kiowa (5.7%, a difference of 0.75%).
| Demographics | Rating | Rank | Unemployment |
| Bermudans | 1.1 /100 | #246 | Tragic 5.6% |
| Immigrants | Cameroon | 1.0 /100 | #247 | Tragic 5.6% |
| Liberians | 0.9 /100 | #248 | Tragic 5.6% |
| Cajuns | 0.8 /100 | #249 | Tragic 5.6% |
| Japanese | 0.8 /100 | #250 | Tragic 5.6% |
| Kiowa | 0.6 /100 | #251 | Tragic 5.7% |
| Hondurans | 0.3 /100 | #252 | Tragic 5.7% |
| Central Americans | 0.3 /100 | #253 | Tragic 5.7% |
| Immigrants | Honduras | 0.3 /100 | #254 | Tragic 5.7% |
| Immigrants | Portugal | 0.2 /100 | #255 | Tragic 5.7% |
| Guatemalans | 0.2 /100 | #256 | Tragic 5.8% |
| Yaqui | 0.2 /100 | #257 | Tragic 5.8% |
| Immigrants | Bahamas | 0.1 /100 | #258 | Tragic 5.8% |
| Sub-Saharan Africans | 0.1 /100 | #259 | Tragic 5.8% |
| Immigrants | Uzbekistan | 0.1 /100 | #260 | Tragic 5.8% |
Demographics Similar to Osage by Unemployment
In terms of unemployment, the demographic groups most similar to Osage are Chickasaw (5.0%, a difference of 0.0%), Maltese (5.0%, a difference of 0.0%), Immigrants from Argentina (5.0%, a difference of 0.040%), Immigrants from Romania (5.0%, a difference of 0.070%), and American (5.0%, a difference of 0.080%).
| Demographics | Rating | Rank | Unemployment |
| Immigrants | Czechoslovakia | 95.1 /100 | #97 | Exceptional 5.0% |
| Romanians | 95.0 /100 | #98 | Exceptional 5.0% |
| Mongolians | 94.8 /100 | #99 | Exceptional 5.0% |
| Estonians | 94.6 /100 | #100 | Exceptional 5.0% |
| Americans | 94.3 /100 | #101 | Exceptional 5.0% |
| Immigrants | Argentina | 94.1 /100 | #102 | Exceptional 5.0% |
| Chickasaw | 94.0 /100 | #103 | Exceptional 5.0% |
| Osage | 94.0 /100 | #104 | Exceptional 5.0% |
| Maltese | 94.0 /100 | #105 | Exceptional 5.0% |
| Immigrants | Romania | 93.7 /100 | #106 | Exceptional 5.0% |
| Immigrants | Turkey | 93.7 /100 | #107 | Exceptional 5.0% |
| Immigrants | Kuwait | 93.7 /100 | #108 | Exceptional 5.0% |
| Immigrants | Eritrea | 93.3 /100 | #109 | Exceptional 5.0% |
| Immigrants | Lithuania | 93.2 /100 | #110 | Exceptional 5.0% |
| Chileans | 93.2 /100 | #111 | Exceptional 5.0% |