Palestinian vs Immigrants from Fiji Unemployment Among Ages 60 to 64 years
COMPARE
Palestinian
Immigrants from Fiji
Unemployment Among Ages 60 to 64 years
Unemployment Among Ages 60 to 64 years Comparison
Palestinians
Immigrants from Fiji
4.8%
UNEMPLOYMENT AMONG AGES 60 TO 64 YEARS
60.5/ 100
METRIC RATING
166th/ 347
METRIC RANK
5.1%
UNEMPLOYMENT AMONG AGES 60 TO 64 YEARS
1.1/ 100
METRIC RATING
248th/ 347
METRIC RANK
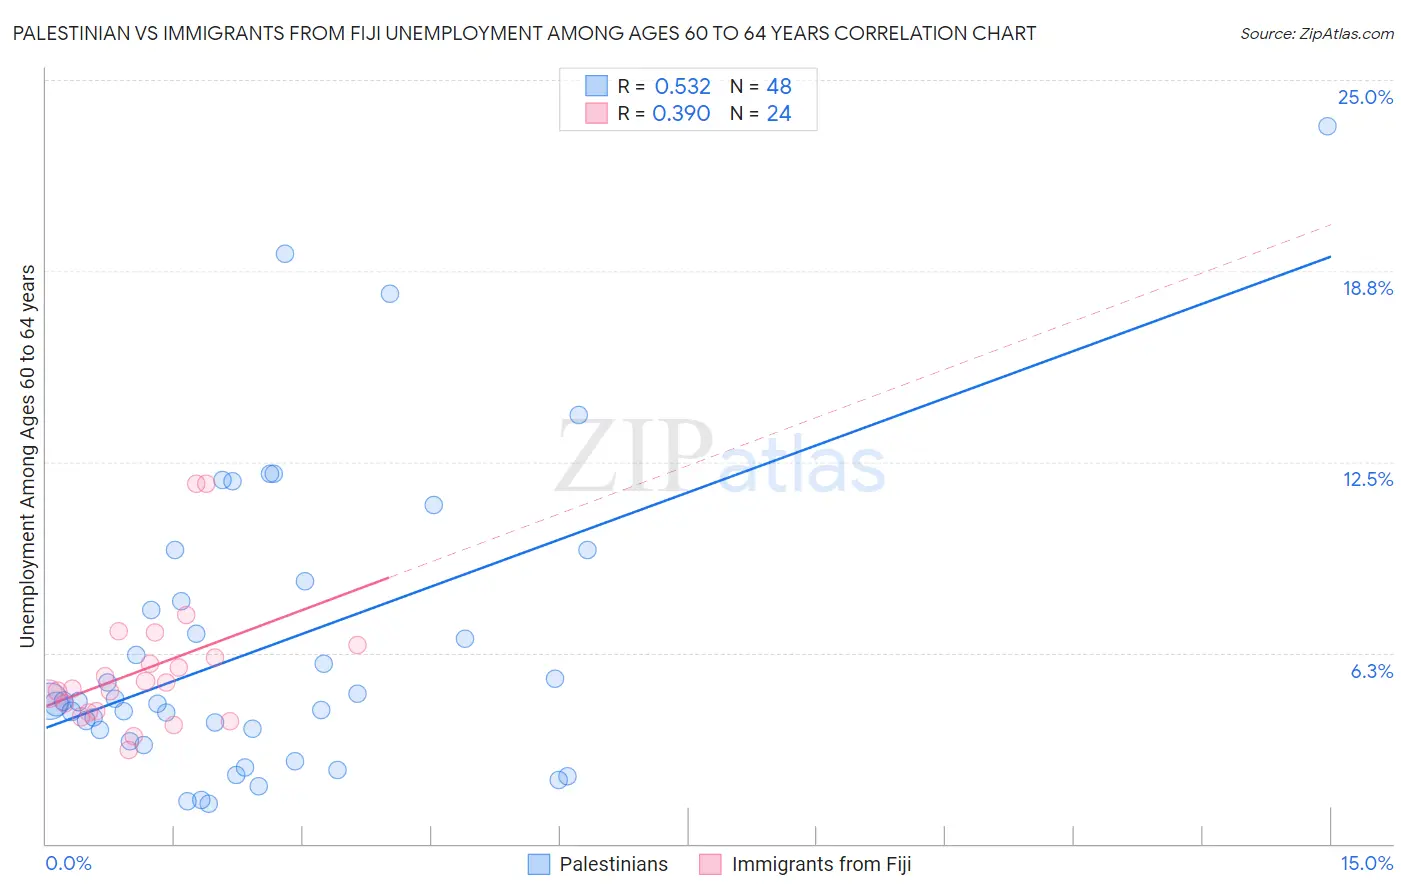
Palestinian vs Immigrants from Fiji Unemployment Among Ages 60 to 64 years Correlation Chart
The statistical analysis conducted on geographies consisting of 206,520,552 people shows a substantial positive correlation between the proportion of Palestinians and unemployment rate among population between the ages 60 and 64 in the United States with a correlation coefficient (R) of 0.532 and weighted average of 4.8%. Similarly, the statistical analysis conducted on geographies consisting of 91,801,699 people shows a mild positive correlation between the proportion of Immigrants from Fiji and unemployment rate among population between the ages 60 and 64 in the United States with a correlation coefficient (R) of 0.390 and weighted average of 5.1%, a difference of 4.4%.
Unemployment Among Ages 60 to 64 years Correlation Summary
| Measurement | Palestinian | Immigrants from Fiji |
| Minimum | 1.3% | 3.1% |
| Maximum | 23.5% | 11.8% |
| Range | 22.2% | 8.7% |
| Mean | 6.5% | 5.7% |
| Median | 4.7% | 5.2% |
| Interquartile 25% (IQ1) | 3.5% | 4.3% |
| Interquartile 75% (IQ3) | 8.3% | 6.3% |
| Interquartile Range (IQR) | 4.7% | 2.0% |
| Standard Deviation (Sample) | 4.9% | 2.2% |
| Standard Deviation (Population) | 4.8% | 2.1% |
Similar Demographics by Unemployment Among Ages 60 to 64 years
Demographics Similar to Palestinians by Unemployment Among Ages 60 to 64 years
In terms of unemployment among ages 60 to 64 years, the demographic groups most similar to Palestinians are Immigrants from Northern Europe (4.8%, a difference of 0.050%), Immigrants from Panama (4.8%, a difference of 0.060%), Immigrants from Southern Europe (4.8%, a difference of 0.14%), Immigrants from Belgium (4.8%, a difference of 0.16%), and Pakistani (4.8%, a difference of 0.16%).
| Demographics | Rating | Rank | Unemployment Among Ages 60 to 64 years |
| Spanish | 65.5 /100 | #159 | Good 4.8% |
| Australians | 65.3 /100 | #160 | Good 4.8% |
| Immigrants | Norway | 65.1 /100 | #161 | Good 4.8% |
| South Africans | 65.1 /100 | #162 | Good 4.8% |
| Immigrants | Belgium | 64.8 /100 | #163 | Good 4.8% |
| Pakistanis | 64.6 /100 | #164 | Good 4.8% |
| Immigrants | Panama | 62.0 /100 | #165 | Good 4.8% |
| Palestinians | 60.5 /100 | #166 | Good 4.8% |
| Immigrants | Northern Europe | 59.1 /100 | #167 | Average 4.8% |
| Immigrants | Southern Europe | 56.7 /100 | #168 | Average 4.8% |
| Immigrants | France | 55.5 /100 | #169 | Average 4.8% |
| Immigrants | Korea | 54.2 /100 | #170 | Average 4.8% |
| Samoans | 53.6 /100 | #171 | Average 4.9% |
| Immigrants | Turkey | 52.8 /100 | #172 | Average 4.9% |
| Immigrants | Hungary | 50.2 /100 | #173 | Average 4.9% |
Demographics Similar to Immigrants from Fiji by Unemployment Among Ages 60 to 64 years
In terms of unemployment among ages 60 to 64 years, the demographic groups most similar to Immigrants from Fiji are South American (5.1%, a difference of 0.030%), Immigrants from South America (5.0%, a difference of 0.050%), Immigrants from North Macedonia (5.0%, a difference of 0.050%), Immigrants from Cambodia (5.1%, a difference of 0.12%), and Immigrants from Uruguay (5.1%, a difference of 0.15%).
| Demographics | Rating | Rank | Unemployment Among Ages 60 to 64 years |
| Indians (Asian) | 2.2 /100 | #241 | Tragic 5.0% |
| Argentineans | 2.1 /100 | #242 | Tragic 5.0% |
| Immigrants | Philippines | 1.9 /100 | #243 | Tragic 5.0% |
| Peruvians | 1.6 /100 | #244 | Tragic 5.0% |
| Comanche | 1.3 /100 | #245 | Tragic 5.0% |
| Immigrants | South America | 1.1 /100 | #246 | Tragic 5.0% |
| Immigrants | North Macedonia | 1.1 /100 | #247 | Tragic 5.0% |
| Immigrants | Fiji | 1.1 /100 | #248 | Tragic 5.1% |
| South Americans | 1.0 /100 | #249 | Tragic 5.1% |
| Immigrants | Cambodia | 0.9 /100 | #250 | Tragic 5.1% |
| Immigrants | Uruguay | 0.9 /100 | #251 | Tragic 5.1% |
| Immigrants | Switzerland | 0.9 /100 | #252 | Tragic 5.1% |
| Immigrants | China | 0.9 /100 | #253 | Tragic 5.1% |
| Costa Ricans | 0.8 /100 | #254 | Tragic 5.1% |
| Estonians | 0.8 /100 | #255 | Tragic 5.1% |