French American Indian vs Latvian Unemployment Among Ages 60 to 64 years
COMPARE
French American Indian
Latvian
Unemployment Among Ages 60 to 64 years
Unemployment Among Ages 60 to 64 years Comparison
French American Indians
Latvians
5.2%
UNEMPLOYMENT AMONG AGES 60 TO 64 YEARS
0.0/ 100
METRIC RATING
280th/ 347
METRIC RANK
4.8%
UNEMPLOYMENT AMONG AGES 60 TO 64 YEARS
79.1/ 100
METRIC RATING
148th/ 347
METRIC RANK
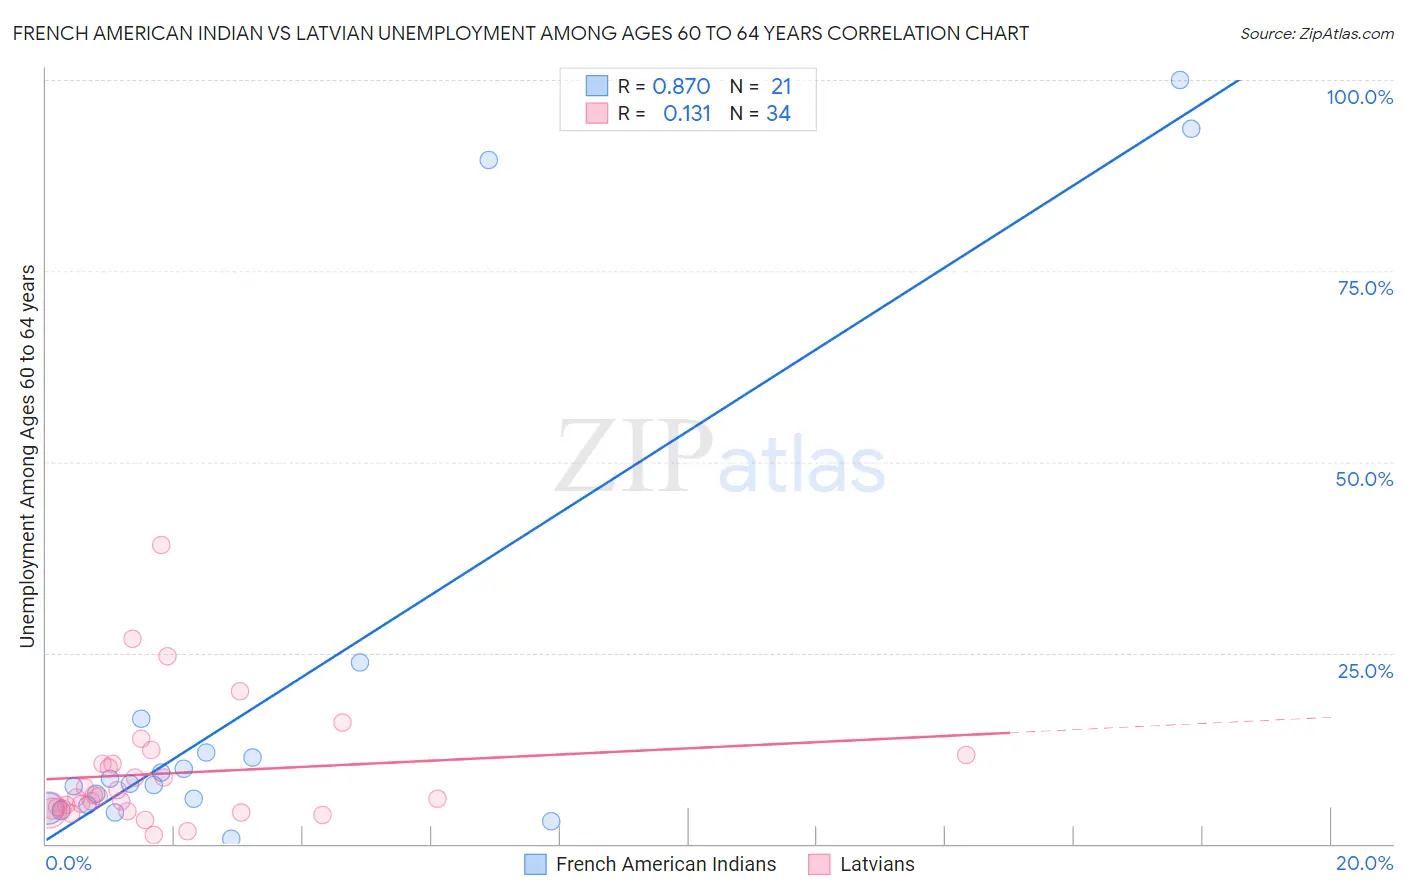
French American Indian vs Latvian Unemployment Among Ages 60 to 64 years Correlation Chart
The statistical analysis conducted on geographies consisting of 125,006,669 people shows a very strong positive correlation between the proportion of French American Indians and unemployment rate among population between the ages 60 and 64 in the United States with a correlation coefficient (R) of 0.870 and weighted average of 5.2%. Similarly, the statistical analysis conducted on geographies consisting of 207,612,955 people shows a poor positive correlation between the proportion of Latvians and unemployment rate among population between the ages 60 and 64 in the United States with a correlation coefficient (R) of 0.131 and weighted average of 4.8%, a difference of 9.1%.
Unemployment Among Ages 60 to 64 years Correlation Summary
| Measurement | French American Indian | Latvian |
| Minimum | 0.60% | 1.2% |
| Maximum | 100.0% | 39.1% |
| Range | 99.4% | 37.9% |
| Mean | 20.5% | 9.2% |
| Median | 7.9% | 6.2% |
| Interquartile 25% (IQ1) | 4.8% | 4.5% |
| Interquartile 75% (IQ3) | 14.2% | 10.5% |
| Interquartile Range (IQR) | 9.4% | 6.0% |
| Standard Deviation (Sample) | 31.3% | 8.0% |
| Standard Deviation (Population) | 30.6% | 7.9% |
Similar Demographics by Unemployment Among Ages 60 to 64 years
Demographics Similar to French American Indians by Unemployment Among Ages 60 to 64 years
In terms of unemployment among ages 60 to 64 years, the demographic groups most similar to French American Indians are Nepalese (5.2%, a difference of 0.010%), Immigrants from Haiti (5.2%, a difference of 0.050%), Mexican (5.2%, a difference of 0.050%), Guatemalan (5.2%, a difference of 0.21%), and Immigrants from Guatemala (5.3%, a difference of 0.48%).
| Demographics | Rating | Rank | Unemployment Among Ages 60 to 64 years |
| Immigrants | Spain | 0.1 /100 | #273 | Tragic 5.2% |
| Hopi | 0.1 /100 | #274 | Tragic 5.2% |
| Immigrants | Hong Kong | 0.1 /100 | #275 | Tragic 5.2% |
| Central Americans | 0.0 /100 | #276 | Tragic 5.2% |
| Immigrants | Caribbean | 0.0 /100 | #277 | Tragic 5.2% |
| Guatemalans | 0.0 /100 | #278 | Tragic 5.2% |
| Nepalese | 0.0 /100 | #279 | Tragic 5.2% |
| French American Indians | 0.0 /100 | #280 | Tragic 5.2% |
| Immigrants | Haiti | 0.0 /100 | #281 | Tragic 5.2% |
| Mexicans | 0.0 /100 | #282 | Tragic 5.2% |
| Immigrants | Guatemala | 0.0 /100 | #283 | Tragic 5.3% |
| Taiwanese | 0.0 /100 | #284 | Tragic 5.3% |
| West Indians | 0.0 /100 | #285 | Tragic 5.3% |
| Mexican American Indians | 0.0 /100 | #286 | Tragic 5.3% |
| Salvadorans | 0.0 /100 | #287 | Tragic 5.3% |
Demographics Similar to Latvians by Unemployment Among Ages 60 to 64 years
In terms of unemployment among ages 60 to 64 years, the demographic groups most similar to Latvians are Arab (4.8%, a difference of 0.020%), Immigrants from Italy (4.8%, a difference of 0.020%), Immigrants from South Africa (4.8%, a difference of 0.030%), Mongolian (4.8%, a difference of 0.12%), and Turkish (4.8%, a difference of 0.16%).
| Demographics | Rating | Rank | Unemployment Among Ages 60 to 64 years |
| Panamanians | 85.5 /100 | #141 | Excellent 4.8% |
| Immigrants | Ethiopia | 85.3 /100 | #142 | Excellent 4.8% |
| Italians | 85.0 /100 | #143 | Excellent 4.8% |
| Immigrants | Pakistan | 83.3 /100 | #144 | Excellent 4.8% |
| Burmese | 83.1 /100 | #145 | Excellent 4.8% |
| Turks | 81.9 /100 | #146 | Excellent 4.8% |
| Mongolians | 81.2 /100 | #147 | Excellent 4.8% |
| Latvians | 79.1 /100 | #148 | Good 4.8% |
| Arabs | 78.8 /100 | #149 | Good 4.8% |
| Immigrants | Italy | 78.7 /100 | #150 | Good 4.8% |
| Immigrants | South Africa | 78.5 /100 | #151 | Good 4.8% |
| Americans | 75.7 /100 | #152 | Good 4.8% |
| Bolivians | 75.5 /100 | #153 | Good 4.8% |
| Chileans | 72.6 /100 | #154 | Good 4.8% |
| Filipinos | 72.1 /100 | #155 | Good 4.8% |