Palestinian vs Mexican American Indian Unemployment Among Ages 60 to 64 years
COMPARE
Palestinian
Mexican American Indian
Unemployment Among Ages 60 to 64 years
Unemployment Among Ages 60 to 64 years Comparison
Palestinians
Mexican American Indians
4.8%
UNEMPLOYMENT AMONG AGES 60 TO 64 YEARS
60.5/ 100
METRIC RATING
166th/ 347
METRIC RANK
5.3%
UNEMPLOYMENT AMONG AGES 60 TO 64 YEARS
0.0/ 100
METRIC RATING
286th/ 347
METRIC RANK
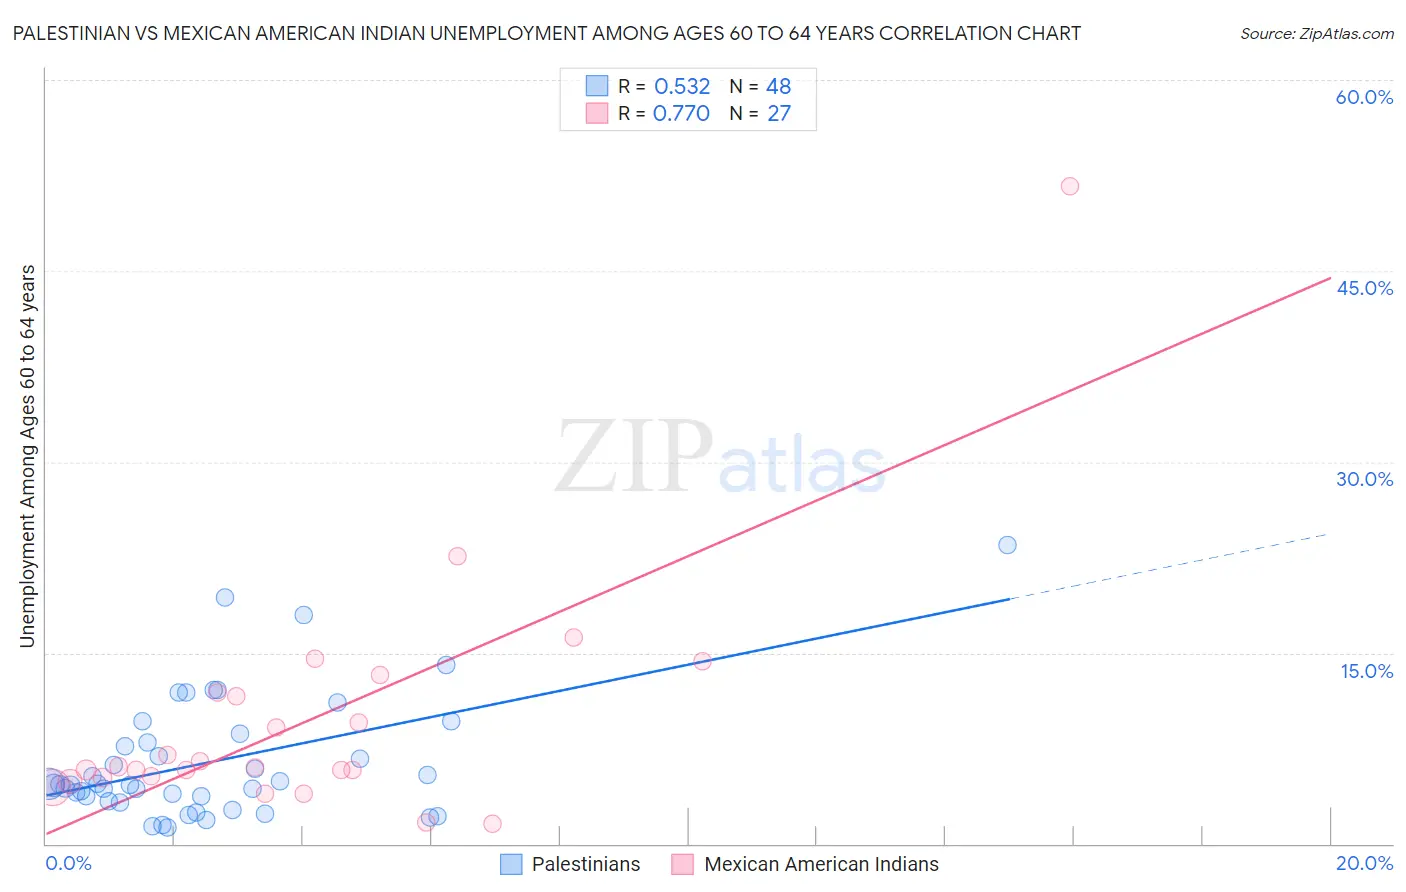
Palestinian vs Mexican American Indian Unemployment Among Ages 60 to 64 years Correlation Chart
The statistical analysis conducted on geographies consisting of 206,520,552 people shows a substantial positive correlation between the proportion of Palestinians and unemployment rate among population between the ages 60 and 64 in the United States with a correlation coefficient (R) of 0.532 and weighted average of 4.8%. Similarly, the statistical analysis conducted on geographies consisting of 293,329,819 people shows a strong positive correlation between the proportion of Mexican American Indians and unemployment rate among population between the ages 60 and 64 in the United States with a correlation coefficient (R) of 0.770 and weighted average of 5.3%, a difference of 9.1%.
Unemployment Among Ages 60 to 64 years Correlation Summary
| Measurement | Palestinian | Mexican American Indian |
| Minimum | 1.3% | 1.6% |
| Maximum | 23.5% | 51.7% |
| Range | 22.2% | 50.1% |
| Mean | 6.5% | 9.6% |
| Median | 4.7% | 6.0% |
| Interquartile 25% (IQ1) | 3.5% | 5.2% |
| Interquartile 75% (IQ3) | 8.3% | 11.9% |
| Interquartile Range (IQR) | 4.7% | 6.7% |
| Standard Deviation (Sample) | 4.9% | 9.7% |
| Standard Deviation (Population) | 4.8% | 9.5% |
Similar Demographics by Unemployment Among Ages 60 to 64 years
Demographics Similar to Palestinians by Unemployment Among Ages 60 to 64 years
In terms of unemployment among ages 60 to 64 years, the demographic groups most similar to Palestinians are Immigrants from Northern Europe (4.8%, a difference of 0.050%), Immigrants from Panama (4.8%, a difference of 0.060%), Immigrants from Southern Europe (4.8%, a difference of 0.14%), Immigrants from Belgium (4.8%, a difference of 0.16%), and Pakistani (4.8%, a difference of 0.16%).
| Demographics | Rating | Rank | Unemployment Among Ages 60 to 64 years |
| Spanish | 65.5 /100 | #159 | Good 4.8% |
| Australians | 65.3 /100 | #160 | Good 4.8% |
| Immigrants | Norway | 65.1 /100 | #161 | Good 4.8% |
| South Africans | 65.1 /100 | #162 | Good 4.8% |
| Immigrants | Belgium | 64.8 /100 | #163 | Good 4.8% |
| Pakistanis | 64.6 /100 | #164 | Good 4.8% |
| Immigrants | Panama | 62.0 /100 | #165 | Good 4.8% |
| Palestinians | 60.5 /100 | #166 | Good 4.8% |
| Immigrants | Northern Europe | 59.1 /100 | #167 | Average 4.8% |
| Immigrants | Southern Europe | 56.7 /100 | #168 | Average 4.8% |
| Immigrants | France | 55.5 /100 | #169 | Average 4.8% |
| Immigrants | Korea | 54.2 /100 | #170 | Average 4.8% |
| Samoans | 53.6 /100 | #171 | Average 4.9% |
| Immigrants | Turkey | 52.8 /100 | #172 | Average 4.9% |
| Immigrants | Hungary | 50.2 /100 | #173 | Average 4.9% |
Demographics Similar to Mexican American Indians by Unemployment Among Ages 60 to 64 years
In terms of unemployment among ages 60 to 64 years, the demographic groups most similar to Mexican American Indians are Salvadoran (5.3%, a difference of 0.040%), West Indian (5.3%, a difference of 0.11%), Trinidadian and Tobagonian (5.3%, a difference of 0.22%), Taiwanese (5.3%, a difference of 0.24%), and Spanish American (5.3%, a difference of 0.25%).
| Demographics | Rating | Rank | Unemployment Among Ages 60 to 64 years |
| Nepalese | 0.0 /100 | #279 | Tragic 5.2% |
| French American Indians | 0.0 /100 | #280 | Tragic 5.2% |
| Immigrants | Haiti | 0.0 /100 | #281 | Tragic 5.2% |
| Mexicans | 0.0 /100 | #282 | Tragic 5.2% |
| Immigrants | Guatemala | 0.0 /100 | #283 | Tragic 5.3% |
| Taiwanese | 0.0 /100 | #284 | Tragic 5.3% |
| West Indians | 0.0 /100 | #285 | Tragic 5.3% |
| Mexican American Indians | 0.0 /100 | #286 | Tragic 5.3% |
| Salvadorans | 0.0 /100 | #287 | Tragic 5.3% |
| Trinidadians and Tobagonians | 0.0 /100 | #288 | Tragic 5.3% |
| Spanish Americans | 0.0 /100 | #289 | Tragic 5.3% |
| Immigrants | Trinidad and Tobago | 0.0 /100 | #290 | Tragic 5.3% |
| Hispanics or Latinos | 0.0 /100 | #291 | Tragic 5.3% |
| Immigrants | Latin America | 0.0 /100 | #292 | Tragic 5.3% |
| Immigrants | Israel | 0.0 /100 | #293 | Tragic 5.3% |