Chilean vs Jordanian Unemployment Among Women with Children Under 6 years
COMPARE
Chilean
Jordanian
Unemployment Among Women with Children Under 6 years
Unemployment Among Women with Children Under 6 years Comparison
Chileans
Jordanians
7.2%
UNEMPLOYMENT AMONG WOMEN WITH CHILDREN UNDER 6 YEARS
97.4/ 100
METRIC RATING
101st/ 347
METRIC RANK
7.3%
UNEMPLOYMENT AMONG WOMEN WITH CHILDREN UNDER 6 YEARS
91.5/ 100
METRIC RATING
127th/ 347
METRIC RANK
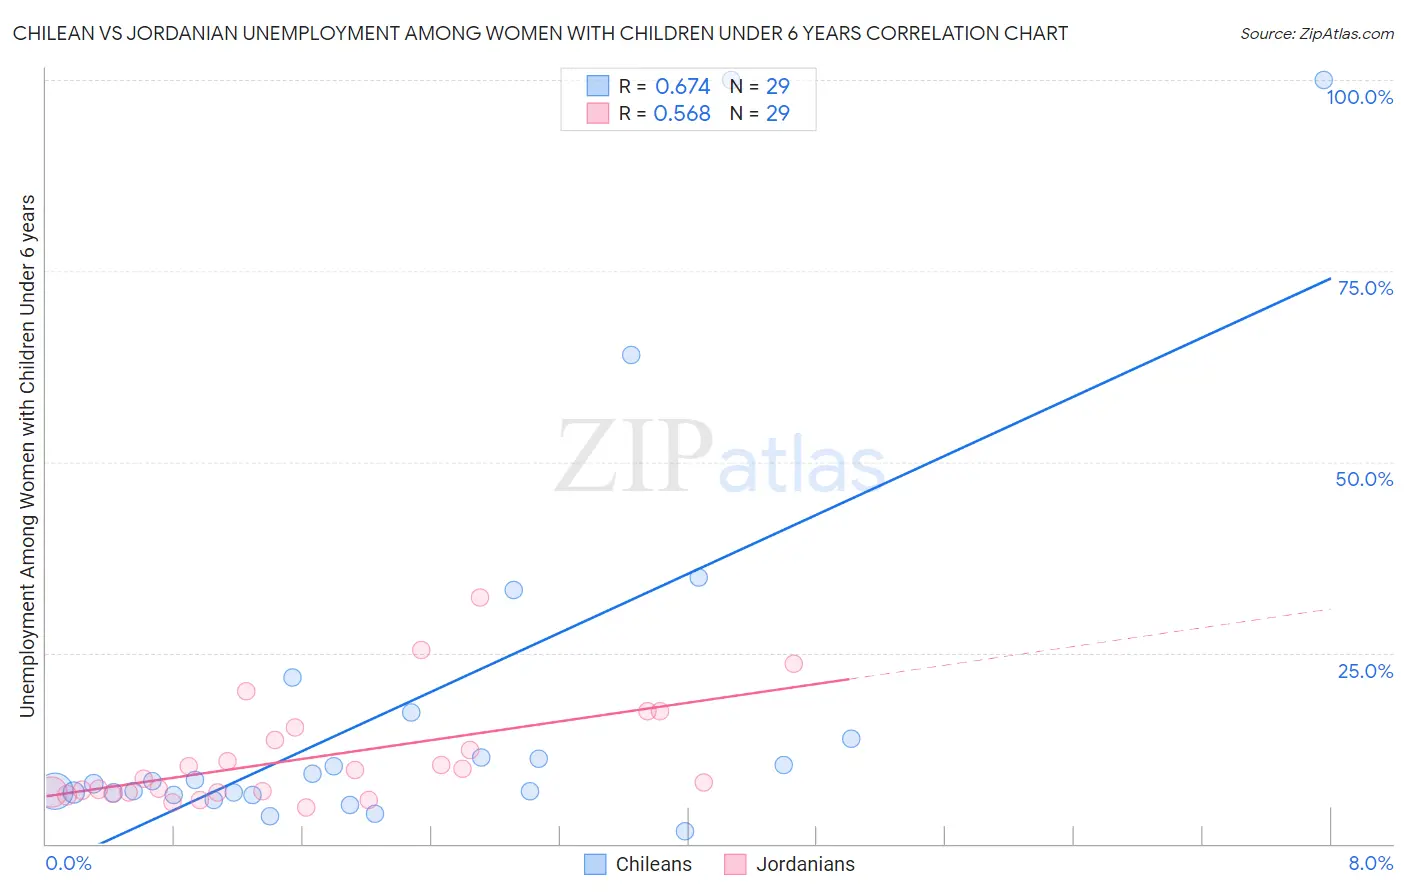
Chilean vs Jordanian Unemployment Among Women with Children Under 6 years Correlation Chart
The statistical analysis conducted on geographies consisting of 212,235,383 people shows a significant positive correlation between the proportion of Chileans and unemployment rate among women with children under the age of 6 in the United States with a correlation coefficient (R) of 0.674 and weighted average of 7.2%. Similarly, the statistical analysis conducted on geographies consisting of 146,717,249 people shows a substantial positive correlation between the proportion of Jordanians and unemployment rate among women with children under the age of 6 in the United States with a correlation coefficient (R) of 0.568 and weighted average of 7.3%, a difference of 2.2%.
Unemployment Among Women with Children Under 6 years Correlation Summary
| Measurement | Chilean | Jordanian |
| Minimum | 1.6% | 4.8% |
| Maximum | 100.0% | 32.3% |
| Range | 98.4% | 27.5% |
| Mean | 18.4% | 11.3% |
| Median | 8.2% | 8.6% |
| Interquartile 25% (IQ1) | 6.5% | 6.7% |
| Interquartile 75% (IQ3) | 15.5% | 14.4% |
| Interquartile Range (IQR) | 9.0% | 7.7% |
| Standard Deviation (Sample) | 25.8% | 6.8% |
| Standard Deviation (Population) | 25.4% | 6.7% |
Similar Demographics by Unemployment Among Women with Children Under 6 years
Demographics Similar to Chileans by Unemployment Among Women with Children Under 6 years
In terms of unemployment among women with children under 6 years, the demographic groups most similar to Chileans are Immigrants from Northern Europe (7.2%, a difference of 0.020%), Immigrants from Nicaragua (7.2%, a difference of 0.030%), Immigrants from Saudi Arabia (7.2%, a difference of 0.030%), Immigrants from Europe (7.2%, a difference of 0.070%), and Russian (7.2%, a difference of 0.11%).
| Demographics | Rating | Rank | Unemployment Among Women with Children Under 6 years |
| Macedonians | 97.7 /100 | #94 | Exceptional 7.2% |
| Romanians | 97.7 /100 | #95 | Exceptional 7.2% |
| Immigrants | Eastern Africa | 97.7 /100 | #96 | Exceptional 7.2% |
| Immigrants | South Eastern Asia | 97.6 /100 | #97 | Exceptional 7.2% |
| Russians | 97.5 /100 | #98 | Exceptional 7.2% |
| Immigrants | Europe | 97.5 /100 | #99 | Exceptional 7.2% |
| Immigrants | Northern Europe | 97.4 /100 | #100 | Exceptional 7.2% |
| Chileans | 97.4 /100 | #101 | Exceptional 7.2% |
| Immigrants | Nicaragua | 97.3 /100 | #102 | Exceptional 7.2% |
| Immigrants | Saudi Arabia | 97.3 /100 | #103 | Exceptional 7.2% |
| Immigrants | Egypt | 97.2 /100 | #104 | Exceptional 7.2% |
| Venezuelans | 97.2 /100 | #105 | Exceptional 7.2% |
| Immigrants | Pakistan | 97.2 /100 | #106 | Exceptional 7.2% |
| Immigrants | Kazakhstan | 97.1 /100 | #107 | Exceptional 7.2% |
| Eastern Europeans | 96.9 /100 | #108 | Exceptional 7.2% |
Demographics Similar to Jordanians by Unemployment Among Women with Children Under 6 years
In terms of unemployment among women with children under 6 years, the demographic groups most similar to Jordanians are Zimbabwean (7.3%, a difference of 0.0%), Immigrants from Burma/Myanmar (7.3%, a difference of 0.10%), Pakistani (7.3%, a difference of 0.16%), Immigrants from South Africa (7.3%, a difference of 0.25%), and Immigrants from Zaire (7.3%, a difference of 0.44%).
| Demographics | Rating | Rank | Unemployment Among Women with Children Under 6 years |
| Iraqis | 93.9 /100 | #120 | Exceptional 7.3% |
| Immigrants | Chile | 93.5 /100 | #121 | Exceptional 7.3% |
| Immigrants | Bosnia and Herzegovina | 93.5 /100 | #122 | Exceptional 7.3% |
| Immigrants | Zaire | 93.3 /100 | #123 | Exceptional 7.3% |
| Immigrants | South Africa | 92.5 /100 | #124 | Exceptional 7.3% |
| Pakistanis | 92.2 /100 | #125 | Exceptional 7.3% |
| Immigrants | Burma/Myanmar | 91.9 /100 | #126 | Exceptional 7.3% |
| Jordanians | 91.5 /100 | #127 | Exceptional 7.3% |
| Zimbabweans | 91.5 /100 | #128 | Exceptional 7.3% |
| Slovenes | 89.2 /100 | #129 | Excellent 7.4% |
| Swedes | 88.4 /100 | #130 | Excellent 7.4% |
| Ukrainians | 88.2 /100 | #131 | Excellent 7.4% |
| Immigrants | Armenia | 87.4 /100 | #132 | Excellent 7.4% |
| Immigrants | Uganda | 86.5 /100 | #133 | Excellent 7.4% |
| Immigrants | Bolivia | 85.7 /100 | #134 | Excellent 7.4% |