Cambodian vs Jordanian Unemployment Among Women with Children Under 6 years
COMPARE
Cambodian
Jordanian
Unemployment Among Women with Children Under 6 years
Unemployment Among Women with Children Under 6 years Comparison
Cambodians
Jordanians
5.9%
UNEMPLOYMENT AMONG WOMEN WITH CHILDREN UNDER 6 YEARS
100.0/ 100
METRIC RATING
4th/ 347
METRIC RANK
7.3%
UNEMPLOYMENT AMONG WOMEN WITH CHILDREN UNDER 6 YEARS
91.5/ 100
METRIC RATING
127th/ 347
METRIC RANK
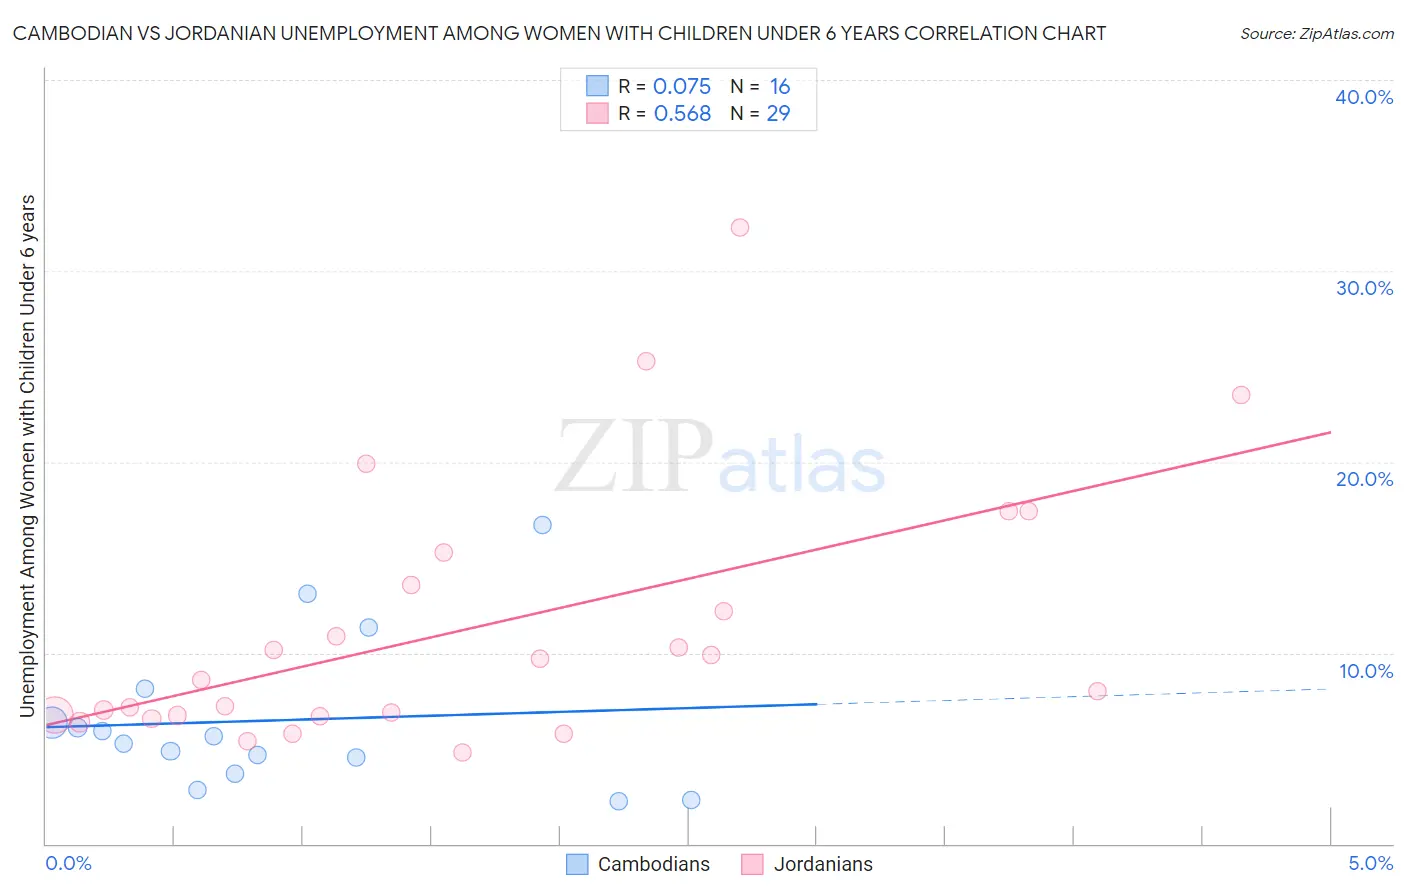
Cambodian vs Jordanian Unemployment Among Women with Children Under 6 years Correlation Chart
The statistical analysis conducted on geographies consisting of 91,894,760 people shows a slight positive correlation between the proportion of Cambodians and unemployment rate among women with children under the age of 6 in the United States with a correlation coefficient (R) of 0.075 and weighted average of 5.9%. Similarly, the statistical analysis conducted on geographies consisting of 146,717,249 people shows a substantial positive correlation between the proportion of Jordanians and unemployment rate among women with children under the age of 6 in the United States with a correlation coefficient (R) of 0.568 and weighted average of 7.3%, a difference of 24.8%.
Unemployment Among Women with Children Under 6 years Correlation Summary
| Measurement | Cambodian | Jordanian |
| Minimum | 2.2% | 4.8% |
| Maximum | 16.7% | 32.3% |
| Range | 14.5% | 27.5% |
| Mean | 6.5% | 11.3% |
| Median | 5.4% | 8.6% |
| Interquartile 25% (IQ1) | 4.1% | 6.7% |
| Interquartile 75% (IQ3) | 7.2% | 14.4% |
| Interquartile Range (IQR) | 3.1% | 7.7% |
| Standard Deviation (Sample) | 4.0% | 6.8% |
| Standard Deviation (Population) | 3.9% | 6.7% |
Similar Demographics by Unemployment Among Women with Children Under 6 years
Demographics Similar to Cambodians by Unemployment Among Women with Children Under 6 years
In terms of unemployment among women with children under 6 years, the demographic groups most similar to Cambodians are Okinawan (5.8%, a difference of 0.88%), Cape Verdean (5.9%, a difference of 1.0%), Immigrants from Hong Kong (5.8%, a difference of 1.8%), Immigrants from Taiwan (6.0%, a difference of 2.7%), and Taiwanese (6.1%, a difference of 3.3%).
| Demographics | Rating | Rank | Unemployment Among Women with Children Under 6 years |
| Immigrants | Cabo Verde | 100.0 /100 | #1 | Exceptional 5.4% |
| Immigrants | Hong Kong | 100.0 /100 | #2 | Exceptional 5.8% |
| Okinawans | 100.0 /100 | #3 | Exceptional 5.8% |
| Cambodians | 100.0 /100 | #4 | Exceptional 5.9% |
| Cape Verdeans | 100.0 /100 | #5 | Exceptional 5.9% |
| Immigrants | Taiwan | 100.0 /100 | #6 | Exceptional 6.0% |
| Taiwanese | 100.0 /100 | #7 | Exceptional 6.1% |
| Immigrants | India | 100.0 /100 | #8 | Exceptional 6.1% |
| Filipinos | 100.0 /100 | #9 | Exceptional 6.1% |
| Immigrants | China | 100.0 /100 | #10 | Exceptional 6.2% |
| Indians (Asian) | 100.0 /100 | #11 | Exceptional 6.3% |
| Immigrants | Singapore | 100.0 /100 | #12 | Exceptional 6.3% |
| Immigrants | Eastern Asia | 100.0 /100 | #13 | Exceptional 6.3% |
| Immigrants | Bulgaria | 100.0 /100 | #14 | Exceptional 6.3% |
| Thais | 100.0 /100 | #15 | Exceptional 6.3% |
Demographics Similar to Jordanians by Unemployment Among Women with Children Under 6 years
In terms of unemployment among women with children under 6 years, the demographic groups most similar to Jordanians are Zimbabwean (7.3%, a difference of 0.0%), Immigrants from Burma/Myanmar (7.3%, a difference of 0.10%), Pakistani (7.3%, a difference of 0.16%), Immigrants from South Africa (7.3%, a difference of 0.25%), and Immigrants from Zaire (7.3%, a difference of 0.44%).
| Demographics | Rating | Rank | Unemployment Among Women with Children Under 6 years |
| Iraqis | 93.9 /100 | #120 | Exceptional 7.3% |
| Immigrants | Chile | 93.5 /100 | #121 | Exceptional 7.3% |
| Immigrants | Bosnia and Herzegovina | 93.5 /100 | #122 | Exceptional 7.3% |
| Immigrants | Zaire | 93.3 /100 | #123 | Exceptional 7.3% |
| Immigrants | South Africa | 92.5 /100 | #124 | Exceptional 7.3% |
| Pakistanis | 92.2 /100 | #125 | Exceptional 7.3% |
| Immigrants | Burma/Myanmar | 91.9 /100 | #126 | Exceptional 7.3% |
| Jordanians | 91.5 /100 | #127 | Exceptional 7.3% |
| Zimbabweans | 91.5 /100 | #128 | Exceptional 7.3% |
| Slovenes | 89.2 /100 | #129 | Excellent 7.4% |
| Swedes | 88.4 /100 | #130 | Excellent 7.4% |
| Ukrainians | 88.2 /100 | #131 | Excellent 7.4% |
| Immigrants | Armenia | 87.4 /100 | #132 | Excellent 7.4% |
| Immigrants | Uganda | 86.5 /100 | #133 | Excellent 7.4% |
| Immigrants | Bolivia | 85.7 /100 | #134 | Excellent 7.4% |