Ottawa vs Yuman Female Unemployment
COMPARE
Ottawa
Yuman
Female Unemployment
Female Unemployment Comparison
Ottawa
Yuman
5.4%
FEMALE UNEMPLOYMENT
11.6/ 100
METRIC RATING
211th/ 347
METRIC RANK
9.6%
FEMALE UNEMPLOYMENT
0.0/ 100
METRIC RATING
345th/ 347
METRIC RANK
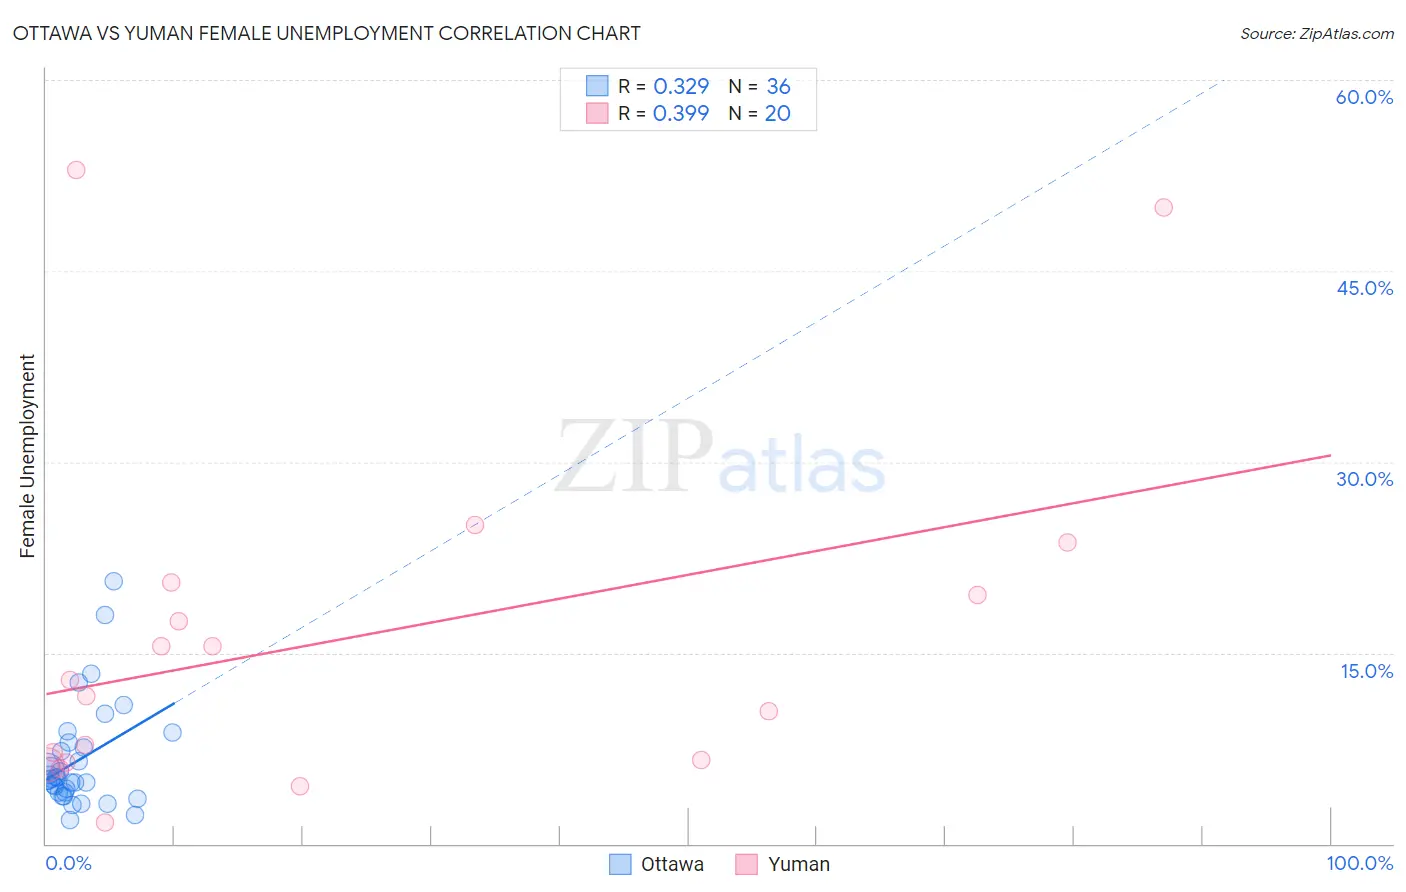
Ottawa vs Yuman Female Unemployment Correlation Chart
The statistical analysis conducted on geographies consisting of 49,812,692 people shows a mild positive correlation between the proportion of Ottawa and unemploymnet rate among females in the United States with a correlation coefficient (R) of 0.329 and weighted average of 5.4%. Similarly, the statistical analysis conducted on geographies consisting of 40,628,844 people shows a mild positive correlation between the proportion of Yuman and unemploymnet rate among females in the United States with a correlation coefficient (R) of 0.399 and weighted average of 9.6%, a difference of 77.0%.
Female Unemployment Correlation Summary
| Measurement | Ottawa | Yuman |
| Minimum | 1.9% | 1.7% |
| Maximum | 20.6% | 52.9% |
| Range | 18.7% | 51.2% |
| Mean | 6.6% | 16.1% |
| Median | 5.2% | 12.2% |
| Interquartile 25% (IQ1) | 4.0% | 6.5% |
| Interquartile 75% (IQ3) | 7.8% | 20.0% |
| Interquartile Range (IQR) | 3.8% | 13.5% |
| Standard Deviation (Sample) | 4.2% | 13.8% |
| Standard Deviation (Population) | 4.1% | 13.4% |
Similar Demographics by Female Unemployment
Demographics Similar to Ottawa by Female Unemployment
In terms of female unemployment, the demographic groups most similar to Ottawa are Uruguayan (5.4%, a difference of 0.020%), Choctaw (5.4%, a difference of 0.10%), Samoan (5.4%, a difference of 0.14%), Seminole (5.4%, a difference of 0.19%), and Immigrants from Nicaragua (5.4%, a difference of 0.21%).
| Demographics | Rating | Rank | Female Unemployment |
| Immigrants | Israel | 19.7 /100 | #204 | Poor 5.4% |
| Immigrants | Afghanistan | 18.9 /100 | #205 | Poor 5.4% |
| Immigrants | Brazil | 18.8 /100 | #206 | Poor 5.4% |
| Creek | 15.4 /100 | #207 | Poor 5.4% |
| Immigrants | Costa Rica | 13.7 /100 | #208 | Poor 5.4% |
| Koreans | 13.4 /100 | #209 | Poor 5.4% |
| Choctaw | 12.3 /100 | #210 | Poor 5.4% |
| Ottawa | 11.6 /100 | #211 | Poor 5.4% |
| Uruguayans | 11.4 /100 | #212 | Poor 5.4% |
| Samoans | 10.6 /100 | #213 | Poor 5.4% |
| Seminole | 10.3 /100 | #214 | Poor 5.4% |
| Immigrants | Nicaragua | 10.2 /100 | #215 | Poor 5.4% |
| Comanche | 10.0 /100 | #216 | Poor 5.4% |
| Peruvians | 9.6 /100 | #217 | Tragic 5.4% |
| Bermudans | 9.0 /100 | #218 | Tragic 5.4% |
Demographics Similar to Yuman by Female Unemployment
In terms of female unemployment, the demographic groups most similar to Yuman are Pima (9.3%, a difference of 2.8%), Arapaho (8.8%, a difference of 9.1%), Yup'ik (10.9%, a difference of 13.4%), Puerto Rican (8.3%, a difference of 15.0%), and Inupiat (8.2%, a difference of 17.6%).
| Demographics | Rating | Rank | Female Unemployment |
| Menominee | 0.0 /100 | #333 | Tragic 7.0% |
| Immigrants | Armenia | 0.0 /100 | #334 | Tragic 7.1% |
| Dominicans | 0.0 /100 | #335 | Tragic 7.2% |
| Immigrants | Dominican Republic | 0.0 /100 | #336 | Tragic 7.2% |
| Navajo | 0.0 /100 | #337 | Tragic 7.3% |
| Tohono O'odham | 0.0 /100 | #338 | Tragic 7.7% |
| Immigrants | Yemen | 0.0 /100 | #339 | Tragic 7.8% |
| Hopi | 0.0 /100 | #340 | Tragic 8.1% |
| Inupiat | 0.0 /100 | #341 | Tragic 8.2% |
| Puerto Ricans | 0.0 /100 | #342 | Tragic 8.3% |
| Arapaho | 0.0 /100 | #343 | Tragic 8.8% |
| Pima | 0.0 /100 | #344 | Tragic 9.3% |
| Yuman | 0.0 /100 | #345 | Tragic 9.6% |
| Yup'ik | 0.0 /100 | #346 | Tragic 10.9% |
| Crow | 0.0 /100 | #347 | Tragic 12.1% |