Ottawa vs Immigrants from Uzbekistan Female Unemployment
COMPARE
Ottawa
Immigrants from Uzbekistan
Female Unemployment
Female Unemployment Comparison
Ottawa
Immigrants from Uzbekistan
5.4%
FEMALE UNEMPLOYMENT
11.6/ 100
METRIC RATING
211th/ 347
METRIC RANK
5.6%
FEMALE UNEMPLOYMENT
1.0/ 100
METRIC RATING
249th/ 347
METRIC RANK
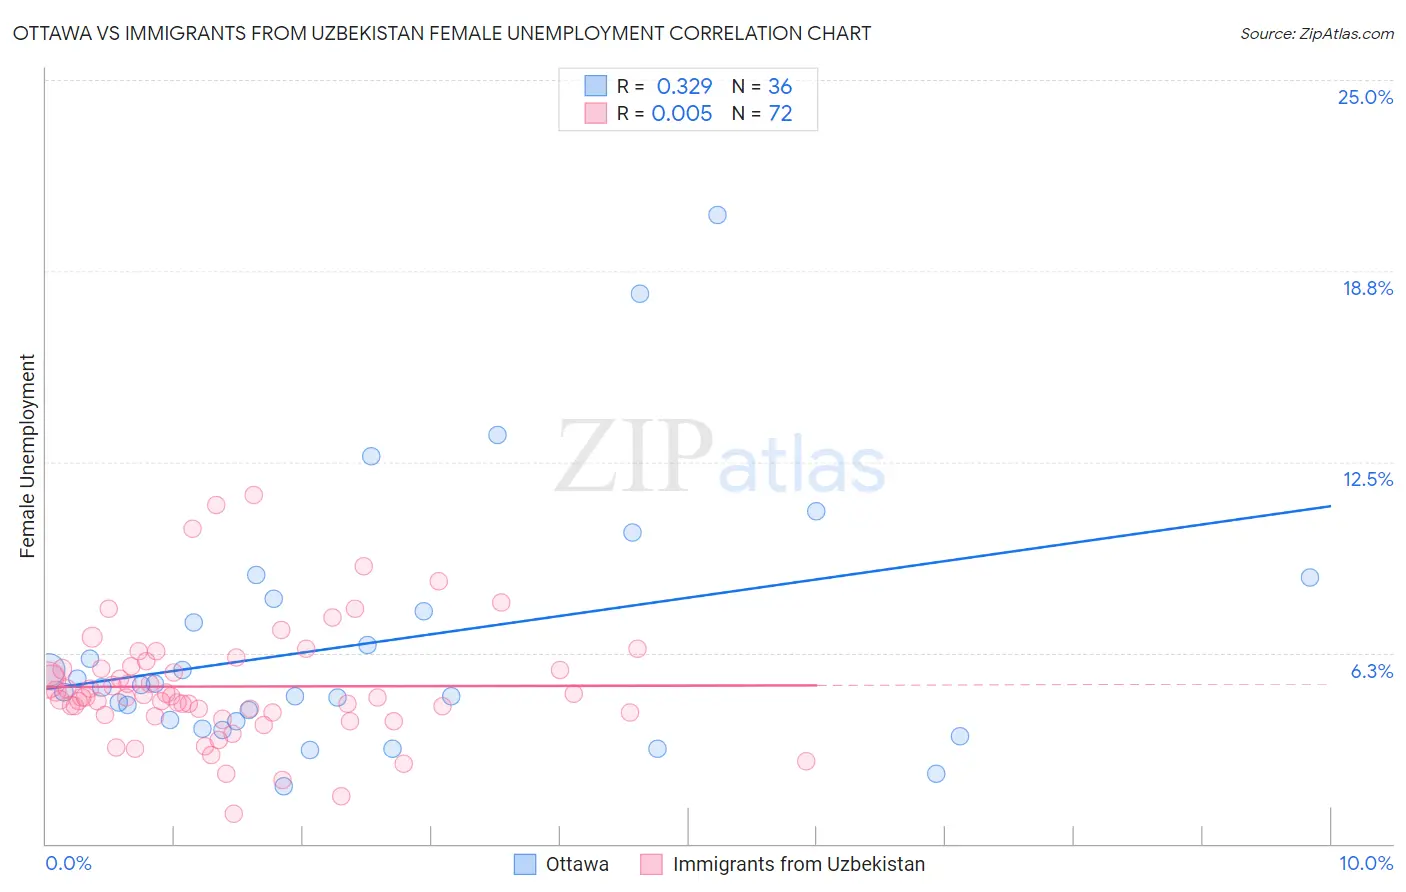
Ottawa vs Immigrants from Uzbekistan Female Unemployment Correlation Chart
The statistical analysis conducted on geographies consisting of 49,812,692 people shows a mild positive correlation between the proportion of Ottawa and unemploymnet rate among females in the United States with a correlation coefficient (R) of 0.329 and weighted average of 5.4%. Similarly, the statistical analysis conducted on geographies consisting of 118,629,225 people shows no correlation between the proportion of Immigrants from Uzbekistan and unemploymnet rate among females in the United States with a correlation coefficient (R) of 0.005 and weighted average of 5.6%, a difference of 3.8%.
Female Unemployment Correlation Summary
| Measurement | Ottawa | Immigrants from Uzbekistan |
| Minimum | 1.9% | 1.0% |
| Maximum | 20.6% | 11.4% |
| Range | 18.7% | 10.4% |
| Mean | 6.6% | 5.1% |
| Median | 5.2% | 4.8% |
| Interquartile 25% (IQ1) | 4.0% | 4.3% |
| Interquartile 75% (IQ3) | 7.8% | 5.8% |
| Interquartile Range (IQR) | 3.8% | 1.5% |
| Standard Deviation (Sample) | 4.2% | 1.9% |
| Standard Deviation (Population) | 4.1% | 1.9% |
Similar Demographics by Female Unemployment
Demographics Similar to Ottawa by Female Unemployment
In terms of female unemployment, the demographic groups most similar to Ottawa are Uruguayan (5.4%, a difference of 0.020%), Choctaw (5.4%, a difference of 0.10%), Samoan (5.4%, a difference of 0.14%), Seminole (5.4%, a difference of 0.19%), and Immigrants from Nicaragua (5.4%, a difference of 0.21%).
| Demographics | Rating | Rank | Female Unemployment |
| Immigrants | Israel | 19.7 /100 | #204 | Poor 5.4% |
| Immigrants | Afghanistan | 18.9 /100 | #205 | Poor 5.4% |
| Immigrants | Brazil | 18.8 /100 | #206 | Poor 5.4% |
| Creek | 15.4 /100 | #207 | Poor 5.4% |
| Immigrants | Costa Rica | 13.7 /100 | #208 | Poor 5.4% |
| Koreans | 13.4 /100 | #209 | Poor 5.4% |
| Choctaw | 12.3 /100 | #210 | Poor 5.4% |
| Ottawa | 11.6 /100 | #211 | Poor 5.4% |
| Uruguayans | 11.4 /100 | #212 | Poor 5.4% |
| Samoans | 10.6 /100 | #213 | Poor 5.4% |
| Seminole | 10.3 /100 | #214 | Poor 5.4% |
| Immigrants | Nicaragua | 10.2 /100 | #215 | Poor 5.4% |
| Comanche | 10.0 /100 | #216 | Poor 5.4% |
| Peruvians | 9.6 /100 | #217 | Tragic 5.4% |
| Bermudans | 9.0 /100 | #218 | Tragic 5.4% |
Demographics Similar to Immigrants from Uzbekistan by Female Unemployment
In terms of female unemployment, the demographic groups most similar to Immigrants from Uzbekistan are Cree (5.6%, a difference of 0.040%), Immigrants from Western Asia (5.6%, a difference of 0.20%), Japanese (5.6%, a difference of 0.28%), Immigrants from Syria (5.6%, a difference of 0.29%), and Assyrian/Chaldean/Syriac (5.6%, a difference of 0.35%).
| Demographics | Rating | Rank | Female Unemployment |
| Marshallese | 2.3 /100 | #242 | Tragic 5.6% |
| Spanish Americans | 2.2 /100 | #243 | Tragic 5.6% |
| Immigrants | Liberia | 1.5 /100 | #244 | Tragic 5.6% |
| Guamanians/Chamorros | 1.4 /100 | #245 | Tragic 5.6% |
| Japanese | 1.2 /100 | #246 | Tragic 5.6% |
| Immigrants | Western Asia | 1.1 /100 | #247 | Tragic 5.6% |
| Cree | 1.0 /100 | #248 | Tragic 5.6% |
| Immigrants | Uzbekistan | 1.0 /100 | #249 | Tragic 5.6% |
| Immigrants | Syria | 0.8 /100 | #250 | Tragic 5.6% |
| Assyrians/Chaldeans/Syriacs | 0.8 /100 | #251 | Tragic 5.6% |
| Cajuns | 0.7 /100 | #252 | Tragic 5.7% |
| Immigrants | Sierra Leone | 0.6 /100 | #253 | Tragic 5.7% |
| Immigrants | Immigrants | 0.6 /100 | #254 | Tragic 5.7% |
| Immigrants | Cameroon | 0.6 /100 | #255 | Tragic 5.7% |
| Sub-Saharan Africans | 0.4 /100 | #256 | Tragic 5.7% |