Immigrants from Spain vs Yuman Female Unemployment
COMPARE
Immigrants from Spain
Yuman
Female Unemployment
Female Unemployment Comparison
Immigrants from Spain
Yuman
5.2%
FEMALE UNEMPLOYMENT
66.8/ 100
METRIC RATING
160th/ 347
METRIC RANK
9.6%
FEMALE UNEMPLOYMENT
0.0/ 100
METRIC RATING
345th/ 347
METRIC RANK
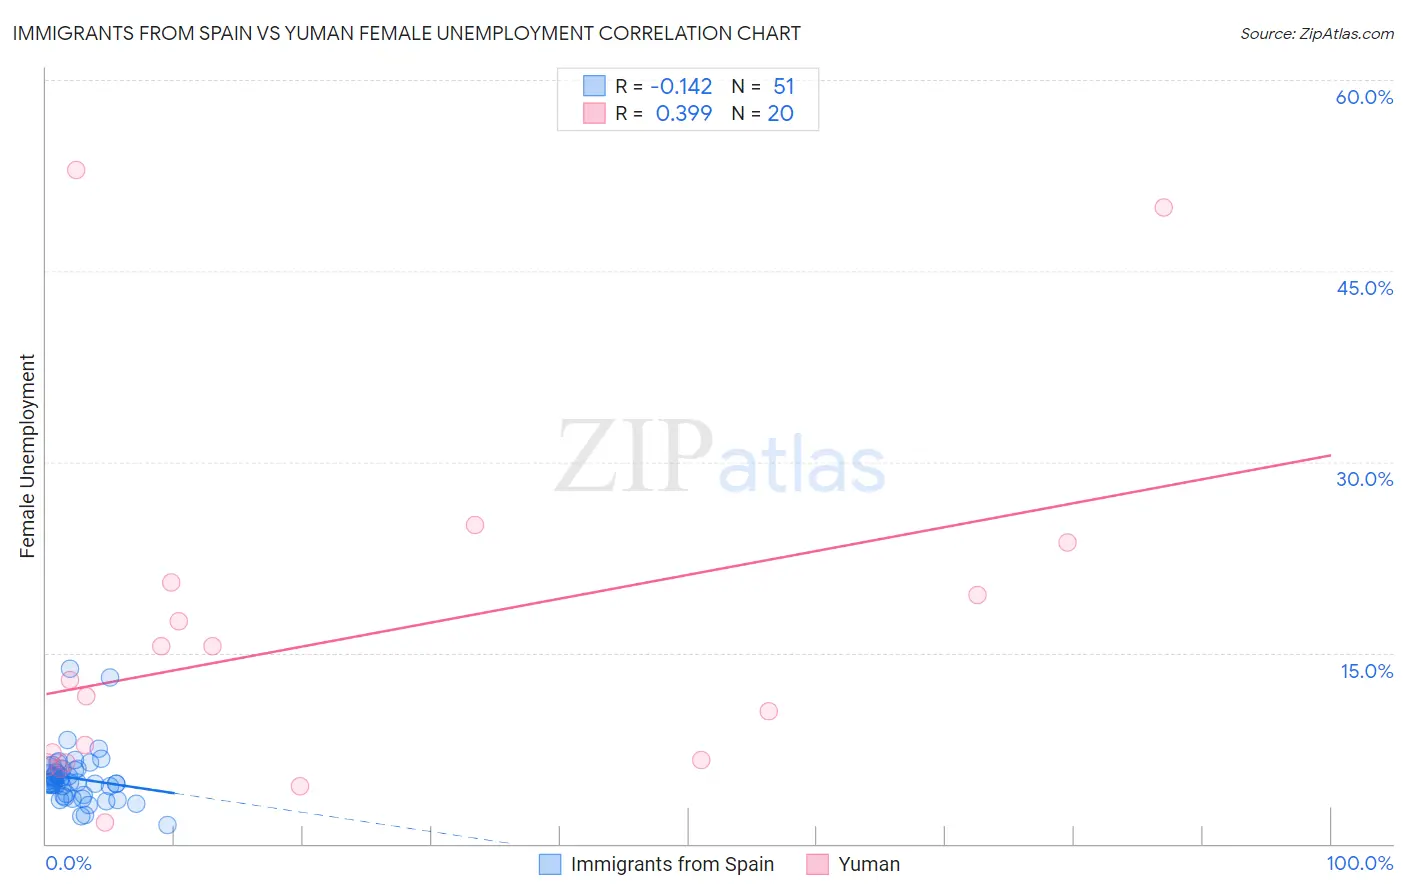
Immigrants from Spain vs Yuman Female Unemployment Correlation Chart
The statistical analysis conducted on geographies consisting of 239,203,477 people shows a poor negative correlation between the proportion of Immigrants from Spain and unemploymnet rate among females in the United States with a correlation coefficient (R) of -0.142 and weighted average of 5.2%. Similarly, the statistical analysis conducted on geographies consisting of 40,628,844 people shows a mild positive correlation between the proportion of Yuman and unemploymnet rate among females in the United States with a correlation coefficient (R) of 0.399 and weighted average of 9.6%, a difference of 84.3%.
Female Unemployment Correlation Summary
| Measurement | Immigrants from Spain | Yuman |
| Minimum | 1.5% | 1.7% |
| Maximum | 13.8% | 52.9% |
| Range | 12.3% | 51.2% |
| Mean | 5.1% | 16.1% |
| Median | 4.8% | 12.2% |
| Interquartile 25% (IQ1) | 3.8% | 6.5% |
| Interquartile 75% (IQ3) | 5.8% | 20.0% |
| Interquartile Range (IQR) | 2.0% | 13.5% |
| Standard Deviation (Sample) | 2.1% | 13.8% |
| Standard Deviation (Population) | 2.1% | 13.4% |
Similar Demographics by Female Unemployment
Demographics Similar to Immigrants from Spain by Female Unemployment
In terms of female unemployment, the demographic groups most similar to Immigrants from Spain are Immigrants from Pakistan (5.2%, a difference of 0.0%), Immigrants from Micronesia (5.2%, a difference of 0.010%), Potawatomi (5.2%, a difference of 0.060%), Albanian (5.2%, a difference of 0.11%), and Immigrants from Asia (5.2%, a difference of 0.17%).
| Demographics | Rating | Rank | Female Unemployment |
| Immigrants | Greece | 74.9 /100 | #153 | Good 5.2% |
| South Africans | 70.8 /100 | #154 | Good 5.2% |
| Immigrants | Egypt | 70.0 /100 | #155 | Good 5.2% |
| Immigrants | Northern Africa | 69.6 /100 | #156 | Good 5.2% |
| Immigrants | Russia | 69.3 /100 | #157 | Good 5.2% |
| Albanians | 68.3 /100 | #158 | Good 5.2% |
| Immigrants | Micronesia | 66.9 /100 | #159 | Good 5.2% |
| Immigrants | Spain | 66.8 /100 | #160 | Good 5.2% |
| Immigrants | Pakistan | 66.7 /100 | #161 | Good 5.2% |
| Potawatomi | 65.9 /100 | #162 | Good 5.2% |
| Immigrants | Asia | 64.3 /100 | #163 | Good 5.2% |
| Bangladeshis | 64.3 /100 | #164 | Good 5.2% |
| Syrians | 62.8 /100 | #165 | Good 5.2% |
| Native Hawaiians | 62.7 /100 | #166 | Good 5.2% |
| Immigrants | Thailand | 62.1 /100 | #167 | Good 5.2% |
Demographics Similar to Yuman by Female Unemployment
In terms of female unemployment, the demographic groups most similar to Yuman are Pima (9.3%, a difference of 2.8%), Arapaho (8.8%, a difference of 9.1%), Yup'ik (10.9%, a difference of 13.4%), Puerto Rican (8.3%, a difference of 15.0%), and Inupiat (8.2%, a difference of 17.6%).
| Demographics | Rating | Rank | Female Unemployment |
| Menominee | 0.0 /100 | #333 | Tragic 7.0% |
| Immigrants | Armenia | 0.0 /100 | #334 | Tragic 7.1% |
| Dominicans | 0.0 /100 | #335 | Tragic 7.2% |
| Immigrants | Dominican Republic | 0.0 /100 | #336 | Tragic 7.2% |
| Navajo | 0.0 /100 | #337 | Tragic 7.3% |
| Tohono O'odham | 0.0 /100 | #338 | Tragic 7.7% |
| Immigrants | Yemen | 0.0 /100 | #339 | Tragic 7.8% |
| Hopi | 0.0 /100 | #340 | Tragic 8.1% |
| Inupiat | 0.0 /100 | #341 | Tragic 8.2% |
| Puerto Ricans | 0.0 /100 | #342 | Tragic 8.3% |
| Arapaho | 0.0 /100 | #343 | Tragic 8.8% |
| Pima | 0.0 /100 | #344 | Tragic 9.3% |
| Yuman | 0.0 /100 | #345 | Tragic 9.6% |
| Yup'ik | 0.0 /100 | #346 | Tragic 10.9% |
| Crow | 0.0 /100 | #347 | Tragic 12.1% |