Ottawa vs Immigrants from Northern Africa Female Unemployment
COMPARE
Ottawa
Immigrants from Northern Africa
Female Unemployment
Female Unemployment Comparison
Ottawa
Immigrants from Northern Africa
5.4%
FEMALE UNEMPLOYMENT
11.6/ 100
METRIC RATING
211th/ 347
METRIC RANK
5.2%
FEMALE UNEMPLOYMENT
69.6/ 100
METRIC RATING
156th/ 347
METRIC RANK
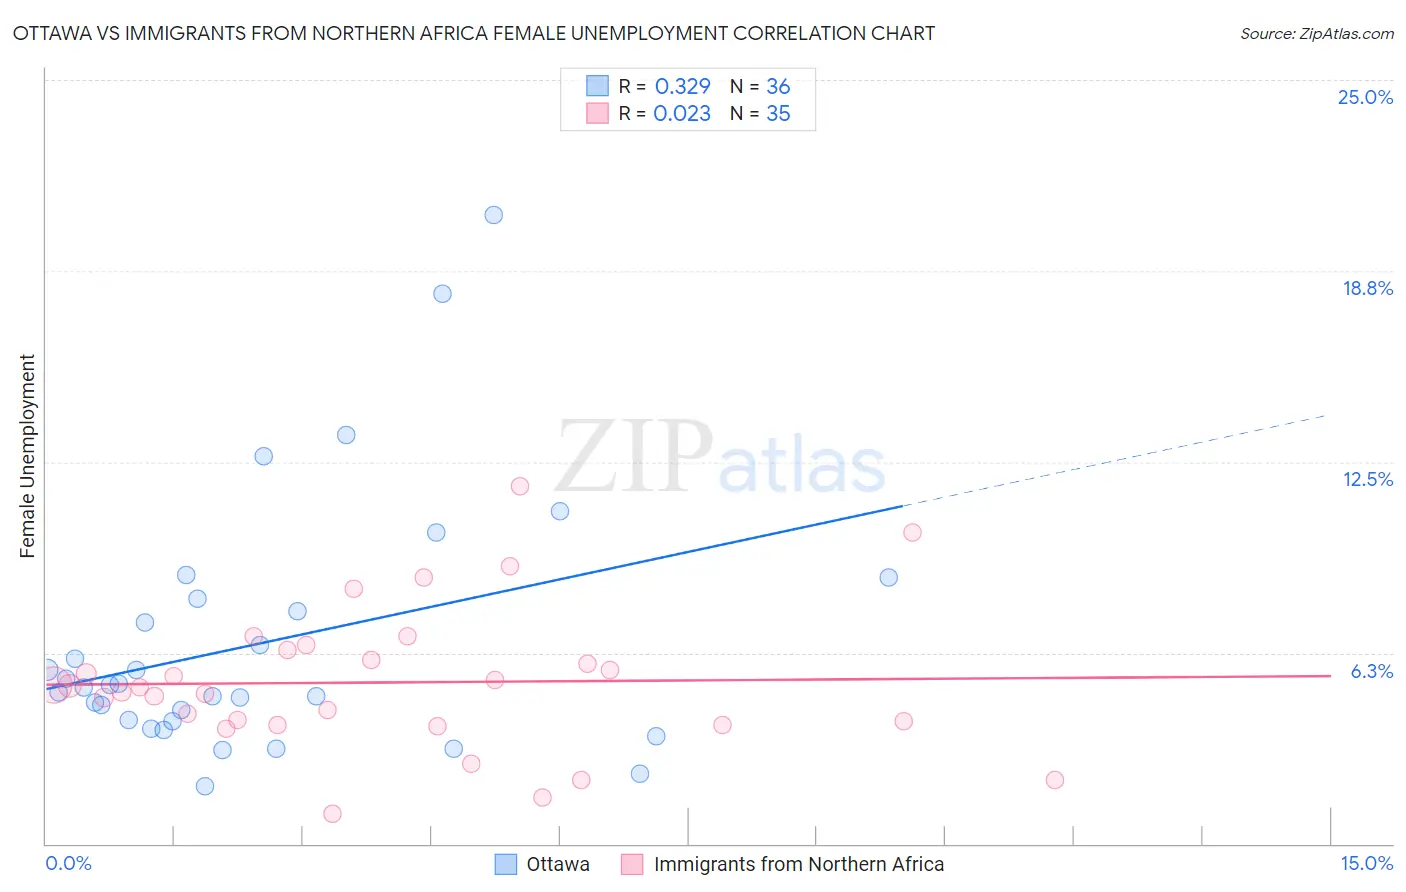
Ottawa vs Immigrants from Northern Africa Female Unemployment Correlation Chart
The statistical analysis conducted on geographies consisting of 49,812,692 people shows a mild positive correlation between the proportion of Ottawa and unemploymnet rate among females in the United States with a correlation coefficient (R) of 0.329 and weighted average of 5.4%. Similarly, the statistical analysis conducted on geographies consisting of 320,534,342 people shows no correlation between the proportion of Immigrants from Northern Africa and unemploymnet rate among females in the United States with a correlation coefficient (R) of 0.023 and weighted average of 5.2%, a difference of 4.4%.
Female Unemployment Correlation Summary
| Measurement | Ottawa | Immigrants from Northern Africa |
| Minimum | 1.9% | 0.96% |
| Maximum | 20.6% | 11.7% |
| Range | 18.7% | 10.7% |
| Mean | 6.6% | 5.3% |
| Median | 5.2% | 5.1% |
| Interquartile 25% (IQ1) | 4.0% | 3.9% |
| Interquartile 75% (IQ3) | 7.8% | 6.3% |
| Interquartile Range (IQR) | 3.8% | 2.4% |
| Standard Deviation (Sample) | 4.2% | 2.3% |
| Standard Deviation (Population) | 4.1% | 2.3% |
Similar Demographics by Female Unemployment
Demographics Similar to Ottawa by Female Unemployment
In terms of female unemployment, the demographic groups most similar to Ottawa are Uruguayan (5.4%, a difference of 0.020%), Choctaw (5.4%, a difference of 0.10%), Samoan (5.4%, a difference of 0.14%), Seminole (5.4%, a difference of 0.19%), and Immigrants from Nicaragua (5.4%, a difference of 0.21%).
| Demographics | Rating | Rank | Female Unemployment |
| Immigrants | Israel | 19.7 /100 | #204 | Poor 5.4% |
| Immigrants | Afghanistan | 18.9 /100 | #205 | Poor 5.4% |
| Immigrants | Brazil | 18.8 /100 | #206 | Poor 5.4% |
| Creek | 15.4 /100 | #207 | Poor 5.4% |
| Immigrants | Costa Rica | 13.7 /100 | #208 | Poor 5.4% |
| Koreans | 13.4 /100 | #209 | Poor 5.4% |
| Choctaw | 12.3 /100 | #210 | Poor 5.4% |
| Ottawa | 11.6 /100 | #211 | Poor 5.4% |
| Uruguayans | 11.4 /100 | #212 | Poor 5.4% |
| Samoans | 10.6 /100 | #213 | Poor 5.4% |
| Seminole | 10.3 /100 | #214 | Poor 5.4% |
| Immigrants | Nicaragua | 10.2 /100 | #215 | Poor 5.4% |
| Comanche | 10.0 /100 | #216 | Poor 5.4% |
| Peruvians | 9.6 /100 | #217 | Tragic 5.4% |
| Bermudans | 9.0 /100 | #218 | Tragic 5.4% |
Demographics Similar to Immigrants from Northern Africa by Female Unemployment
In terms of female unemployment, the demographic groups most similar to Immigrants from Northern Africa are Immigrants from Russia (5.2%, a difference of 0.020%), Immigrants from Egypt (5.2%, a difference of 0.030%), South African (5.2%, a difference of 0.080%), Albanian (5.2%, a difference of 0.10%), and Immigrants from Micronesia (5.2%, a difference of 0.19%).
| Demographics | Rating | Rank | Female Unemployment |
| Asians | 78.3 /100 | #149 | Good 5.2% |
| Egyptians | 78.3 /100 | #150 | Good 5.2% |
| Immigrants | China | 75.9 /100 | #151 | Good 5.2% |
| Immigrants | Italy | 75.0 /100 | #152 | Good 5.2% |
| Immigrants | Greece | 74.9 /100 | #153 | Good 5.2% |
| South Africans | 70.8 /100 | #154 | Good 5.2% |
| Immigrants | Egypt | 70.0 /100 | #155 | Good 5.2% |
| Immigrants | Northern Africa | 69.6 /100 | #156 | Good 5.2% |
| Immigrants | Russia | 69.3 /100 | #157 | Good 5.2% |
| Albanians | 68.3 /100 | #158 | Good 5.2% |
| Immigrants | Micronesia | 66.9 /100 | #159 | Good 5.2% |
| Immigrants | Spain | 66.8 /100 | #160 | Good 5.2% |
| Immigrants | Pakistan | 66.7 /100 | #161 | Good 5.2% |
| Potawatomi | 65.9 /100 | #162 | Good 5.2% |
| Immigrants | Asia | 64.3 /100 | #163 | Good 5.2% |