Immigrants from Syria vs Tlingit-Haida Male Unemployment
COMPARE
Immigrants from Syria
Tlingit-Haida
Male Unemployment
Male Unemployment Comparison
Immigrants from Syria
Tlingit-Haida
5.5%
MALE UNEMPLOYMENT
9.3/ 100
METRIC RATING
207th/ 347
METRIC RANK
6.0%
MALE UNEMPLOYMENT
0.0/ 100
METRIC RATING
276th/ 347
METRIC RANK
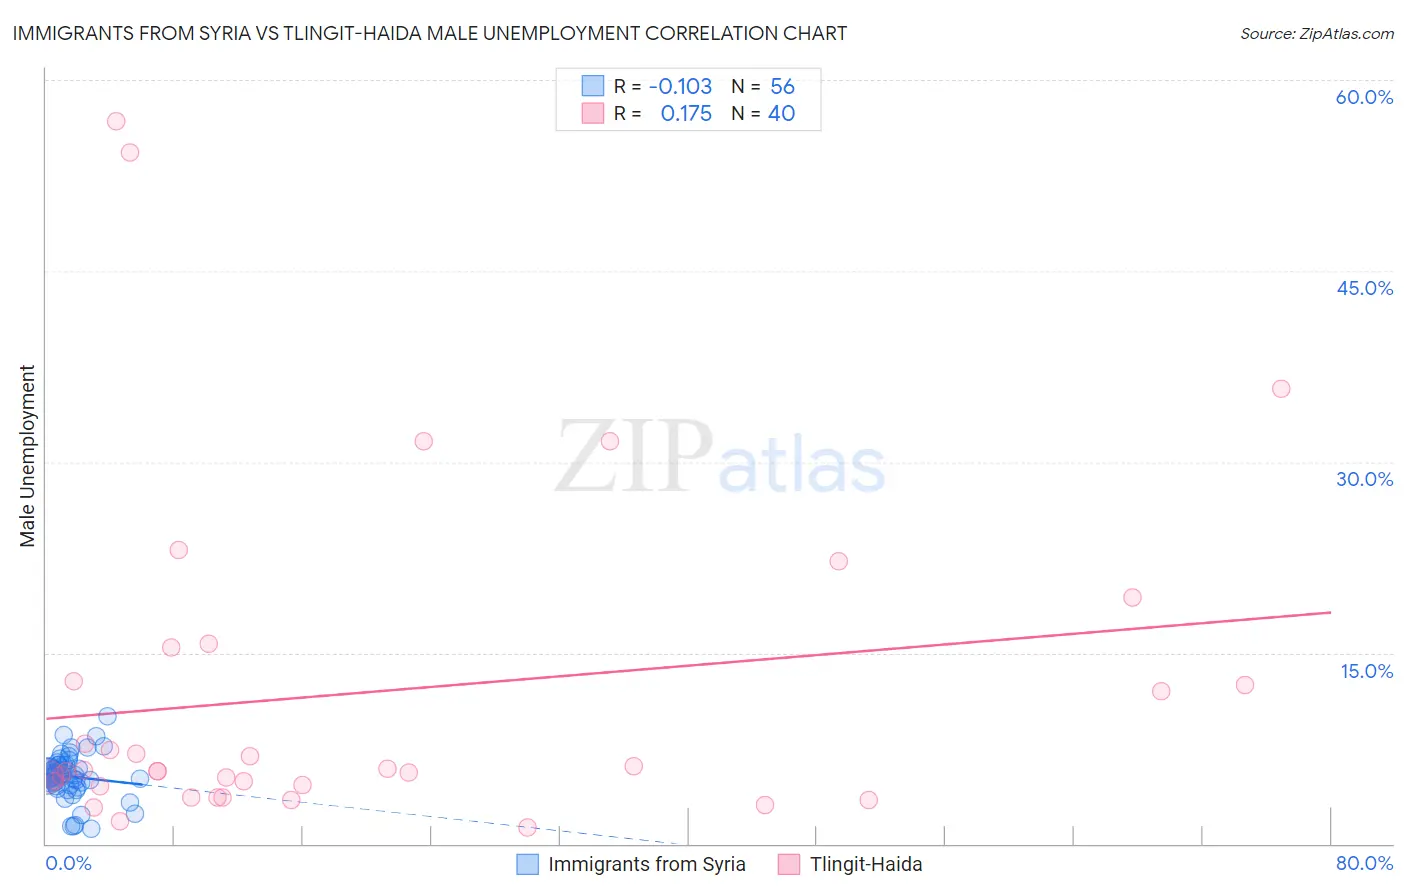
Immigrants from Syria vs Tlingit-Haida Male Unemployment Correlation Chart
The statistical analysis conducted on geographies consisting of 173,829,424 people shows a poor negative correlation between the proportion of Immigrants from Syria and unemployment rate among males in the United States with a correlation coefficient (R) of -0.103 and weighted average of 5.5%. Similarly, the statistical analysis conducted on geographies consisting of 60,678,234 people shows a poor positive correlation between the proportion of Tlingit-Haida and unemployment rate among males in the United States with a correlation coefficient (R) of 0.175 and weighted average of 6.0%, a difference of 10.2%.
Male Unemployment Correlation Summary
| Measurement | Immigrants from Syria | Tlingit-Haida |
| Minimum | 1.2% | 1.3% |
| Maximum | 10.0% | 56.8% |
| Range | 8.8% | 55.5% |
| Mean | 5.3% | 11.9% |
| Median | 5.4% | 5.8% |
| Interquartile 25% (IQ1) | 4.6% | 4.6% |
| Interquartile 75% (IQ3) | 6.2% | 14.1% |
| Interquartile Range (IQR) | 1.6% | 9.5% |
| Standard Deviation (Sample) | 1.8% | 13.3% |
| Standard Deviation (Population) | 1.8% | 13.1% |
Similar Demographics by Male Unemployment
Demographics Similar to Immigrants from Syria by Male Unemployment
In terms of male unemployment, the demographic groups most similar to Immigrants from Syria are Immigrants from Ukraine (5.5%, a difference of 0.10%), Immigrants from Lebanon (5.5%, a difference of 0.13%), Immigrants from Middle Africa (5.5%, a difference of 0.18%), South American Indian (5.5%, a difference of 0.31%), and Immigrants from Costa Rica (5.5%, a difference of 0.32%).
| Demographics | Rating | Rank | Male Unemployment |
| Immigrants | Zaire | 13.7 /100 | #200 | Poor 5.4% |
| Immigrants | Philippines | 13.5 /100 | #201 | Poor 5.4% |
| Immigrants | Nonimmigrants | 13.1 /100 | #202 | Poor 5.4% |
| Immigrants | Laos | 13.0 /100 | #203 | Poor 5.4% |
| Guamanians/Chamorros | 12.3 /100 | #204 | Poor 5.4% |
| Immigrants | Costa Rica | 11.4 /100 | #205 | Poor 5.5% |
| Immigrants | Ukraine | 9.9 /100 | #206 | Tragic 5.5% |
| Immigrants | Syria | 9.3 /100 | #207 | Tragic 5.5% |
| Immigrants | Lebanon | 8.6 /100 | #208 | Tragic 5.5% |
| Immigrants | Middle Africa | 8.3 /100 | #209 | Tragic 5.5% |
| South American Indians | 7.6 /100 | #210 | Tragic 5.5% |
| Israelis | 7.4 /100 | #211 | Tragic 5.5% |
| Hmong | 7.0 /100 | #212 | Tragic 5.5% |
| Ugandans | 6.3 /100 | #213 | Tragic 5.5% |
| Puget Sound Salish | 5.6 /100 | #214 | Tragic 5.5% |
Demographics Similar to Tlingit-Haida by Male Unemployment
In terms of male unemployment, the demographic groups most similar to Tlingit-Haida are Menominee (6.0%, a difference of 0.10%), Immigrants from Sierra Leone (6.0%, a difference of 0.25%), Immigrants from Liberia (6.1%, a difference of 0.42%), Immigrants from Uzbekistan (6.0%, a difference of 0.43%), and Armenian (6.0%, a difference of 0.43%).
| Demographics | Rating | Rank | Male Unemployment |
| Immigrants | Nigeria | 0.0 /100 | #269 | Tragic 6.0% |
| Sub-Saharan Africans | 0.0 /100 | #270 | Tragic 6.0% |
| Blackfeet | 0.0 /100 | #271 | Tragic 6.0% |
| Immigrants | Uzbekistan | 0.0 /100 | #272 | Tragic 6.0% |
| Armenians | 0.0 /100 | #273 | Tragic 6.0% |
| Immigrants | Sierra Leone | 0.0 /100 | #274 | Tragic 6.0% |
| Menominee | 0.0 /100 | #275 | Tragic 6.0% |
| Tlingit-Haida | 0.0 /100 | #276 | Tragic 6.0% |
| Immigrants | Liberia | 0.0 /100 | #277 | Tragic 6.1% |
| Immigrants | Fiji | 0.0 /100 | #278 | Tragic 6.1% |
| Ghanaians | 0.0 /100 | #279 | Tragic 6.1% |
| Immigrants | Ghana | 0.0 /100 | #280 | Tragic 6.2% |
| Sierra Leoneans | 0.0 /100 | #281 | Tragic 6.2% |
| Ecuadorians | 0.0 /100 | #282 | Tragic 6.2% |
| Immigrants | Western Africa | 0.0 /100 | #283 | Tragic 6.2% |