Immigrants from Cabo Verde vs Immigrants from Eritrea Unemployment Among Women with Children Under 6 years
COMPARE
Immigrants from Cabo Verde
Immigrants from Eritrea
Unemployment Among Women with Children Under 6 years
Unemployment Among Women with Children Under 6 years Comparison
Immigrants from Cabo Verde
Immigrants from Eritrea
5.4%
UNEMPLOYMENT AMONG WOMEN WITH CHILDREN UNDER 6 YEARS
100.0/ 100
METRIC RATING
1st/ 347
METRIC RANK
7.0%
UNEMPLOYMENT AMONG WOMEN WITH CHILDREN UNDER 6 YEARS
99.4/ 100
METRIC RATING
69th/ 347
METRIC RANK
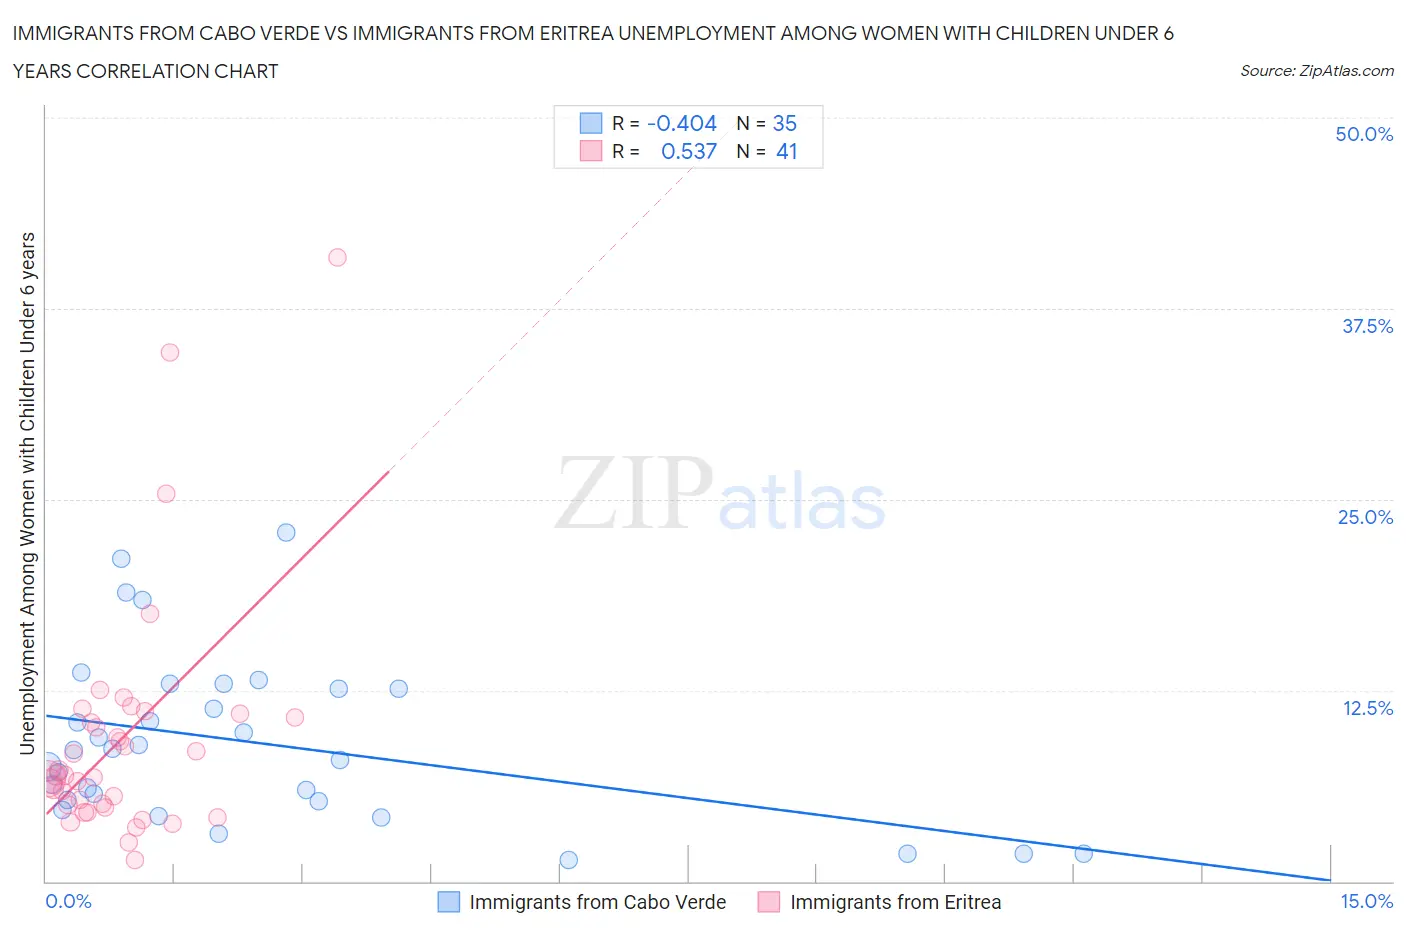
Immigrants from Cabo Verde vs Immigrants from Eritrea Unemployment Among Women with Children Under 6 years Correlation Chart
The statistical analysis conducted on geographies consisting of 34,461,767 people shows a moderate negative correlation between the proportion of Immigrants from Cabo Verde and unemployment rate among women with children under the age of 6 in the United States with a correlation coefficient (R) of -0.404 and weighted average of 5.4%. Similarly, the statistical analysis conducted on geographies consisting of 96,202,979 people shows a substantial positive correlation between the proportion of Immigrants from Eritrea and unemployment rate among women with children under the age of 6 in the United States with a correlation coefficient (R) of 0.537 and weighted average of 7.0%, a difference of 29.8%.
Unemployment Among Women with Children Under 6 years Correlation Summary
| Measurement | Immigrants from Cabo Verde | Immigrants from Eritrea |
| Minimum | 1.4% | 1.4% |
| Maximum | 22.8% | 40.8% |
| Range | 21.4% | 39.4% |
| Mean | 9.1% | 9.3% |
| Median | 8.6% | 6.9% |
| Interquartile 25% (IQ1) | 5.2% | 4.9% |
| Interquartile 75% (IQ3) | 12.6% | 10.9% |
| Interquartile Range (IQR) | 7.4% | 6.0% |
| Standard Deviation (Sample) | 5.5% | 7.8% |
| Standard Deviation (Population) | 5.4% | 7.7% |
Similar Demographics by Unemployment Among Women with Children Under 6 years
Demographics Similar to Immigrants from Cabo Verde by Unemployment Among Women with Children Under 6 years
In terms of unemployment among women with children under 6 years, the demographic groups most similar to Immigrants from Cabo Verde are Immigrants from Hong Kong (5.8%, a difference of 7.4%), Okinawan (5.8%, a difference of 8.3%), Cambodian (5.9%, a difference of 9.3%), Cape Verdean (5.9%, a difference of 10.4%), and Immigrants from Taiwan (6.0%, a difference of 12.3%).
| Demographics | Rating | Rank | Unemployment Among Women with Children Under 6 years |
| Immigrants | Cabo Verde | 100.0 /100 | #1 | Exceptional 5.4% |
| Immigrants | Hong Kong | 100.0 /100 | #2 | Exceptional 5.8% |
| Okinawans | 100.0 /100 | #3 | Exceptional 5.8% |
| Cambodians | 100.0 /100 | #4 | Exceptional 5.9% |
| Cape Verdeans | 100.0 /100 | #5 | Exceptional 5.9% |
| Immigrants | Taiwan | 100.0 /100 | #6 | Exceptional 6.0% |
| Taiwanese | 100.0 /100 | #7 | Exceptional 6.1% |
| Immigrants | India | 100.0 /100 | #8 | Exceptional 6.1% |
| Filipinos | 100.0 /100 | #9 | Exceptional 6.1% |
| Immigrants | China | 100.0 /100 | #10 | Exceptional 6.2% |
| Indians (Asian) | 100.0 /100 | #11 | Exceptional 6.3% |
| Immigrants | Singapore | 100.0 /100 | #12 | Exceptional 6.3% |
| Immigrants | Eastern Asia | 100.0 /100 | #13 | Exceptional 6.3% |
| Immigrants | Bulgaria | 100.0 /100 | #14 | Exceptional 6.3% |
| Thais | 100.0 /100 | #15 | Exceptional 6.3% |
Demographics Similar to Immigrants from Eritrea by Unemployment Among Women with Children Under 6 years
In terms of unemployment among women with children under 6 years, the demographic groups most similar to Immigrants from Eritrea are Immigrants from Iraq (7.0%, a difference of 0.010%), Paraguayan (7.0%, a difference of 0.030%), Afghan (7.0%, a difference of 0.040%), Cuban (7.0%, a difference of 0.14%), and Immigrants from Netherlands (7.0%, a difference of 0.26%).
| Demographics | Rating | Rank | Unemployment Among Women with Children Under 6 years |
| Somalis | 99.7 /100 | #62 | Exceptional 6.9% |
| Maltese | 99.7 /100 | #63 | Exceptional 6.9% |
| Tongans | 99.7 /100 | #64 | Exceptional 6.9% |
| Immigrants | Kuwait | 99.7 /100 | #65 | Exceptional 6.9% |
| Immigrants | Belgium | 99.6 /100 | #66 | Exceptional 6.9% |
| Immigrants | Netherlands | 99.5 /100 | #67 | Exceptional 7.0% |
| Paraguayans | 99.4 /100 | #68 | Exceptional 7.0% |
| Immigrants | Eritrea | 99.4 /100 | #69 | Exceptional 7.0% |
| Immigrants | Iraq | 99.4 /100 | #70 | Exceptional 7.0% |
| Afghans | 99.4 /100 | #71 | Exceptional 7.0% |
| Cubans | 99.4 /100 | #72 | Exceptional 7.0% |
| Immigrants | Czechoslovakia | 99.2 /100 | #73 | Exceptional 7.0% |
| Turks | 99.2 /100 | #74 | Exceptional 7.0% |
| Immigrants | Eastern Europe | 99.0 /100 | #75 | Exceptional 7.1% |
| Estonians | 99.0 /100 | #76 | Exceptional 7.1% |