Immigrants from Grenada vs Immigrants from Eritrea Unemployment Among Women with Children Under 6 years
COMPARE
Immigrants from Grenada
Immigrants from Eritrea
Unemployment Among Women with Children Under 6 years
Unemployment Among Women with Children Under 6 years Comparison
Immigrants from Grenada
Immigrants from Eritrea
7.6%
UNEMPLOYMENT AMONG WOMEN WITH CHILDREN UNDER 6 YEARS
59.0/ 100
METRIC RATING
171st/ 347
METRIC RANK
7.0%
UNEMPLOYMENT AMONG WOMEN WITH CHILDREN UNDER 6 YEARS
99.4/ 100
METRIC RATING
69th/ 347
METRIC RANK
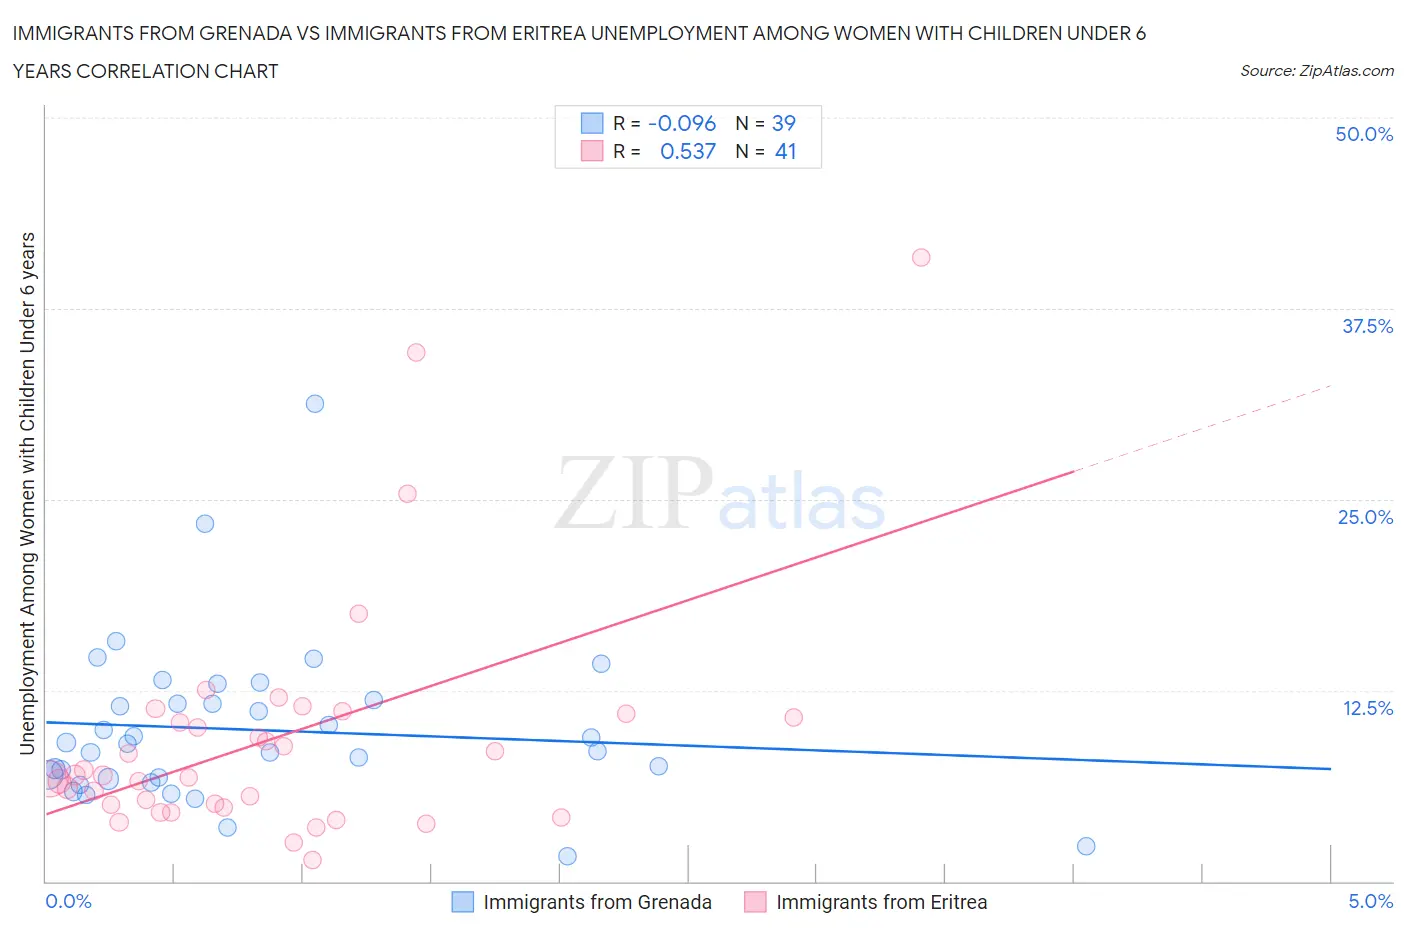
Immigrants from Grenada vs Immigrants from Eritrea Unemployment Among Women with Children Under 6 years Correlation Chart
The statistical analysis conducted on geographies consisting of 61,595,410 people shows a slight negative correlation between the proportion of Immigrants from Grenada and unemployment rate among women with children under the age of 6 in the United States with a correlation coefficient (R) of -0.096 and weighted average of 7.6%. Similarly, the statistical analysis conducted on geographies consisting of 96,202,979 people shows a substantial positive correlation between the proportion of Immigrants from Eritrea and unemployment rate among women with children under the age of 6 in the United States with a correlation coefficient (R) of 0.537 and weighted average of 7.0%, a difference of 8.7%.
Unemployment Among Women with Children Under 6 years Correlation Summary
| Measurement | Immigrants from Grenada | Immigrants from Eritrea |
| Minimum | 1.6% | 1.4% |
| Maximum | 31.3% | 40.8% |
| Range | 29.7% | 39.4% |
| Mean | 9.9% | 9.3% |
| Median | 9.0% | 6.9% |
| Interquartile 25% (IQ1) | 6.7% | 4.9% |
| Interquartile 75% (IQ3) | 11.9% | 10.9% |
| Interquartile Range (IQR) | 5.2% | 6.0% |
| Standard Deviation (Sample) | 5.4% | 7.8% |
| Standard Deviation (Population) | 5.3% | 7.7% |
Similar Demographics by Unemployment Among Women with Children Under 6 years
Demographics Similar to Immigrants from Grenada by Unemployment Among Women with Children Under 6 years
In terms of unemployment among women with children under 6 years, the demographic groups most similar to Immigrants from Grenada are Czech (7.6%, a difference of 0.060%), Immigrants from North America (7.6%, a difference of 0.090%), Immigrants from Scotland (7.6%, a difference of 0.16%), Immigrants from Canada (7.6%, a difference of 0.18%), and Kenyan (7.6%, a difference of 0.25%).
| Demographics | Rating | Rank | Unemployment Among Women with Children Under 6 years |
| Ugandans | 65.8 /100 | #164 | Good 7.6% |
| Immigrants | South America | 65.6 /100 | #165 | Good 7.6% |
| Belgians | 63.5 /100 | #166 | Good 7.6% |
| Kenyans | 62.5 /100 | #167 | Good 7.6% |
| Immigrants | Canada | 61.6 /100 | #168 | Good 7.6% |
| Immigrants | Scotland | 61.3 /100 | #169 | Good 7.6% |
| Czechs | 59.8 /100 | #170 | Average 7.6% |
| Immigrants | Grenada | 59.0 /100 | #171 | Average 7.6% |
| Immigrants | North America | 57.7 /100 | #172 | Average 7.6% |
| Cree | 51.6 /100 | #173 | Average 7.6% |
| Immigrants | Laos | 50.0 /100 | #174 | Average 7.6% |
| Panamanians | 49.6 /100 | #175 | Average 7.6% |
| Puget Sound Salish | 47.7 /100 | #176 | Average 7.7% |
| Austrians | 46.0 /100 | #177 | Average 7.7% |
| Immigrants | England | 45.4 /100 | #178 | Average 7.7% |
Demographics Similar to Immigrants from Eritrea by Unemployment Among Women with Children Under 6 years
In terms of unemployment among women with children under 6 years, the demographic groups most similar to Immigrants from Eritrea are Immigrants from Iraq (7.0%, a difference of 0.010%), Paraguayan (7.0%, a difference of 0.030%), Afghan (7.0%, a difference of 0.040%), Cuban (7.0%, a difference of 0.14%), and Immigrants from Netherlands (7.0%, a difference of 0.26%).
| Demographics | Rating | Rank | Unemployment Among Women with Children Under 6 years |
| Somalis | 99.7 /100 | #62 | Exceptional 6.9% |
| Maltese | 99.7 /100 | #63 | Exceptional 6.9% |
| Tongans | 99.7 /100 | #64 | Exceptional 6.9% |
| Immigrants | Kuwait | 99.7 /100 | #65 | Exceptional 6.9% |
| Immigrants | Belgium | 99.6 /100 | #66 | Exceptional 6.9% |
| Immigrants | Netherlands | 99.5 /100 | #67 | Exceptional 7.0% |
| Paraguayans | 99.4 /100 | #68 | Exceptional 7.0% |
| Immigrants | Eritrea | 99.4 /100 | #69 | Exceptional 7.0% |
| Immigrants | Iraq | 99.4 /100 | #70 | Exceptional 7.0% |
| Afghans | 99.4 /100 | #71 | Exceptional 7.0% |
| Cubans | 99.4 /100 | #72 | Exceptional 7.0% |
| Immigrants | Czechoslovakia | 99.2 /100 | #73 | Exceptional 7.0% |
| Turks | 99.2 /100 | #74 | Exceptional 7.0% |
| Immigrants | Eastern Europe | 99.0 /100 | #75 | Exceptional 7.1% |
| Estonians | 99.0 /100 | #76 | Exceptional 7.1% |