Osage vs Subsaharan African Unemployment Among Women with Children Under 6 years
COMPARE
Osage
Subsaharan African
Unemployment Among Women with Children Under 6 years
Unemployment Among Women with Children Under 6 years Comparison
Osage
Sub-Saharan Africans
9.5%
UNEMPLOYMENT AMONG WOMEN WITH CHILDREN UNDER 6 YEARS
0.0/ 100
METRIC RATING
318th/ 347
METRIC RANK
8.4%
UNEMPLOYMENT AMONG WOMEN WITH CHILDREN UNDER 6 YEARS
0.2/ 100
METRIC RATING
268th/ 347
METRIC RANK
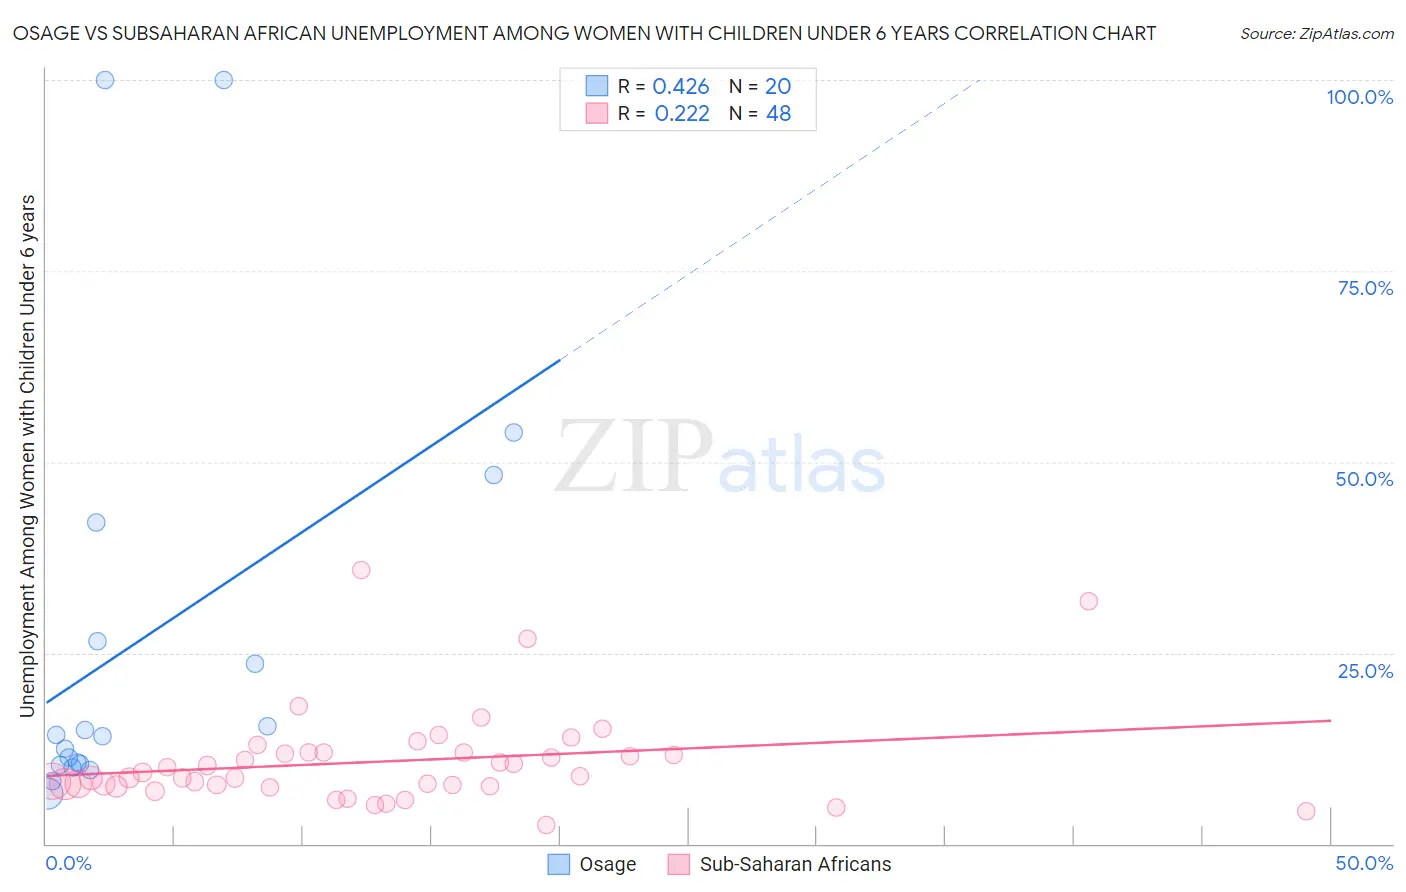
Osage vs Subsaharan African Unemployment Among Women with Children Under 6 years Correlation Chart
The statistical analysis conducted on geographies consisting of 83,364,360 people shows a moderate positive correlation between the proportion of Osage and unemployment rate among women with children under the age of 6 in the United States with a correlation coefficient (R) of 0.426 and weighted average of 9.5%. Similarly, the statistical analysis conducted on geographies consisting of 364,369,549 people shows a weak positive correlation between the proportion of Sub-Saharan Africans and unemployment rate among women with children under the age of 6 in the United States with a correlation coefficient (R) of 0.222 and weighted average of 8.4%, a difference of 12.5%.
Unemployment Among Women with Children Under 6 years Correlation Summary
| Measurement | Osage | Subsaharan African |
| Minimum | 6.6% | 2.4% |
| Maximum | 100.0% | 35.8% |
| Range | 93.4% | 33.4% |
| Mean | 27.1% | 10.8% |
| Median | 14.2% | 8.8% |
| Interquartile 25% (IQ1) | 10.4% | 7.6% |
| Interquartile 75% (IQ3) | 34.3% | 11.9% |
| Interquartile Range (IQR) | 23.9% | 4.3% |
| Standard Deviation (Sample) | 28.4% | 6.4% |
| Standard Deviation (Population) | 27.7% | 6.3% |
Similar Demographics by Unemployment Among Women with Children Under 6 years
Demographics Similar to Osage by Unemployment Among Women with Children Under 6 years
In terms of unemployment among women with children under 6 years, the demographic groups most similar to Osage are Dutch West Indian (9.5%, a difference of 0.060%), Houma (9.4%, a difference of 0.85%), Marshallese (9.6%, a difference of 1.0%), Potawatomi (9.6%, a difference of 1.1%), and Central American Indian (9.6%, a difference of 1.1%).
| Demographics | Rating | Rank | Unemployment Among Women with Children Under 6 years |
| French American Indians | 0.0 /100 | #311 | Tragic 9.2% |
| Immigrants | Azores | 0.0 /100 | #312 | Tragic 9.2% |
| Americans | 0.0 /100 | #313 | Tragic 9.3% |
| Fijians | 0.0 /100 | #314 | Tragic 9.3% |
| Cherokee | 0.0 /100 | #315 | Tragic 9.3% |
| Houma | 0.0 /100 | #316 | Tragic 9.4% |
| Dutch West Indians | 0.0 /100 | #317 | Tragic 9.5% |
| Osage | 0.0 /100 | #318 | Tragic 9.5% |
| Marshallese | 0.0 /100 | #319 | Tragic 9.6% |
| Potawatomi | 0.0 /100 | #320 | Tragic 9.6% |
| Central American Indians | 0.0 /100 | #321 | Tragic 9.6% |
| Alaska Natives | 0.0 /100 | #322 | Tragic 9.6% |
| Immigrants | Bahamas | 0.0 /100 | #323 | Tragic 9.6% |
| Paiute | 0.0 /100 | #324 | Tragic 9.7% |
| Choctaw | 0.0 /100 | #325 | Tragic 9.8% |
Demographics Similar to Sub-Saharan Africans by Unemployment Among Women with Children Under 6 years
In terms of unemployment among women with children under 6 years, the demographic groups most similar to Sub-Saharan Africans are Immigrants from Haiti (8.4%, a difference of 0.090%), Belizean (8.4%, a difference of 0.10%), French Canadian (8.4%, a difference of 0.37%), Immigrants from Honduras (8.4%, a difference of 0.37%), and Honduran (8.4%, a difference of 0.42%).
| Demographics | Rating | Rank | Unemployment Among Women with Children Under 6 years |
| Immigrants | Liberia | 0.3 /100 | #261 | Tragic 8.4% |
| West Indians | 0.3 /100 | #262 | Tragic 8.4% |
| Scotch-Irish | 0.3 /100 | #263 | Tragic 8.4% |
| Hondurans | 0.3 /100 | #264 | Tragic 8.4% |
| French Canadians | 0.3 /100 | #265 | Tragic 8.4% |
| Immigrants | Honduras | 0.3 /100 | #266 | Tragic 8.4% |
| Belizeans | 0.2 /100 | #267 | Tragic 8.4% |
| Sub-Saharan Africans | 0.2 /100 | #268 | Tragic 8.4% |
| Immigrants | Haiti | 0.2 /100 | #269 | Tragic 8.4% |
| Immigrants | Senegal | 0.2 /100 | #270 | Tragic 8.5% |
| Immigrants | Congo | 0.2 /100 | #271 | Tragic 8.5% |
| Mexican American Indians | 0.1 /100 | #272 | Tragic 8.5% |
| Slovaks | 0.1 /100 | #273 | Tragic 8.5% |
| Immigrants | Cameroon | 0.1 /100 | #274 | Tragic 8.6% |
| Immigrants | Latin America | 0.1 /100 | #275 | Tragic 8.6% |