Immigrants from Kenya vs Yuman Unemployment Among Women with Children Ages 6 to 17 years
COMPARE
Immigrants from Kenya
Yuman
Unemployment Among Women with Children Ages 6 to 17 years
Unemployment Among Women with Children Ages 6 to 17 years Comparison
Immigrants from Kenya
Yuman
8.8%
UNEMPLOYMENT AMONG WOMEN WITH CHILDREN AGES 6 TO 17 YEARS
86.1/ 100
METRIC RATING
143rd/ 347
METRIC RANK
14.8%
UNEMPLOYMENT AMONG WOMEN WITH CHILDREN AGES 6 TO 17 YEARS
0.0/ 100
METRIC RATING
342nd/ 347
METRIC RANK
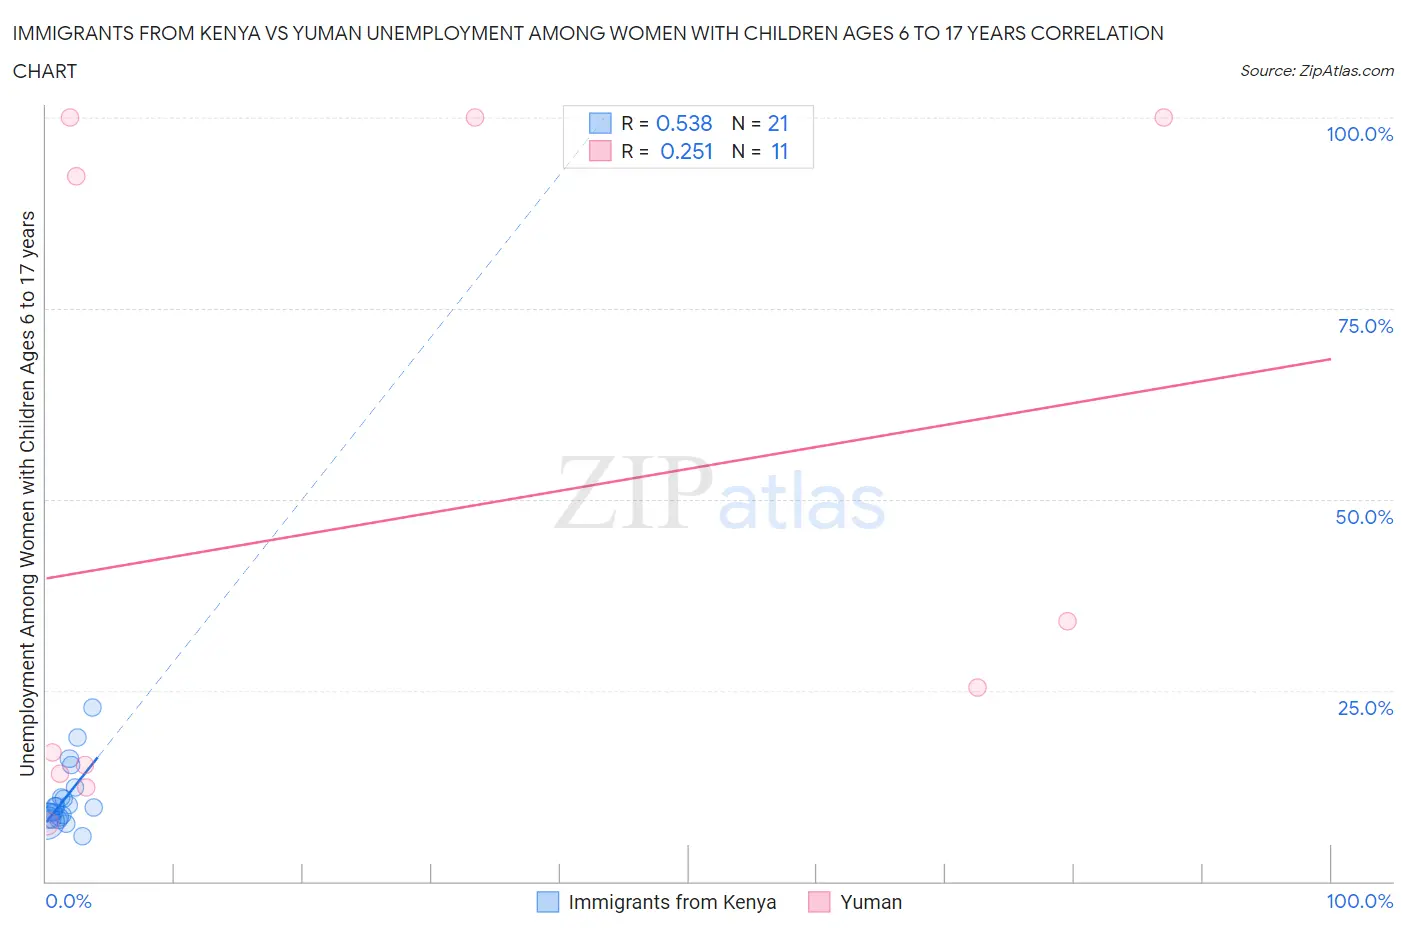
Immigrants from Kenya vs Yuman Unemployment Among Women with Children Ages 6 to 17 years Correlation Chart
The statistical analysis conducted on geographies consisting of 177,643,514 people shows a substantial positive correlation between the proportion of Immigrants from Kenya and unemployment rate among women with children between the ages 6 and 17 in the United States with a correlation coefficient (R) of 0.538 and weighted average of 8.8%. Similarly, the statistical analysis conducted on geographies consisting of 38,308,560 people shows a weak positive correlation between the proportion of Yuman and unemployment rate among women with children between the ages 6 and 17 in the United States with a correlation coefficient (R) of 0.251 and weighted average of 14.8%, a difference of 68.6%.
Unemployment Among Women with Children Ages 6 to 17 years Correlation Summary
| Measurement | Immigrants from Kenya | Yuman |
| Minimum | 5.9% | 7.5% |
| Maximum | 22.8% | 100.0% |
| Range | 16.9% | 92.5% |
| Mean | 10.8% | 47.1% |
| Median | 9.7% | 25.4% |
| Interquartile 25% (IQ1) | 8.2% | 14.1% |
| Interquartile 75% (IQ3) | 11.6% | 100.0% |
| Interquartile Range (IQR) | 3.4% | 85.9% |
| Standard Deviation (Sample) | 4.1% | 41.1% |
| Standard Deviation (Population) | 4.0% | 39.2% |
Similar Demographics by Unemployment Among Women with Children Ages 6 to 17 years
Demographics Similar to Immigrants from Kenya by Unemployment Among Women with Children Ages 6 to 17 years
In terms of unemployment among women with children ages 6 to 17 years, the demographic groups most similar to Immigrants from Kenya are Russian (8.8%, a difference of 0.030%), Kenyan (8.8%, a difference of 0.050%), Immigrants from Austria (8.8%, a difference of 0.13%), Serbian (8.8%, a difference of 0.15%), and Immigrants from Poland (8.8%, a difference of 0.22%).
| Demographics | Rating | Rank | Unemployment Among Women with Children Ages 6 to 17 years |
| Immigrants | Latvia | 90.4 /100 | #136 | Exceptional 8.7% |
| Immigrants | Argentina | 90.0 /100 | #137 | Excellent 8.7% |
| Immigrants | Ethiopia | 89.5 /100 | #138 | Excellent 8.8% |
| Northern Europeans | 89.2 /100 | #139 | Excellent 8.8% |
| Immigrants | Poland | 88.3 /100 | #140 | Excellent 8.8% |
| Serbians | 87.6 /100 | #141 | Excellent 8.8% |
| Immigrants | Austria | 87.5 /100 | #142 | Excellent 8.8% |
| Immigrants | Kenya | 86.1 /100 | #143 | Excellent 8.8% |
| Russians | 85.8 /100 | #144 | Excellent 8.8% |
| Kenyans | 85.6 /100 | #145 | Excellent 8.8% |
| Chileans | 80.8 /100 | #146 | Excellent 8.8% |
| Immigrants | Bangladesh | 79.4 /100 | #147 | Good 8.8% |
| Costa Ricans | 77.0 /100 | #148 | Good 8.8% |
| Croatians | 76.0 /100 | #149 | Good 8.8% |
| Greeks | 75.2 /100 | #150 | Good 8.9% |
Demographics Similar to Yuman by Unemployment Among Women with Children Ages 6 to 17 years
In terms of unemployment among women with children ages 6 to 17 years, the demographic groups most similar to Yuman are Inupiat (14.9%, a difference of 0.29%), Navajo (14.2%, a difference of 4.6%), Puerto Rican (13.9%, a difference of 6.8%), Cheyenne (16.4%, a difference of 10.6%), and Sioux (13.2%, a difference of 11.9%).
| Demographics | Rating | Rank | Unemployment Among Women with Children Ages 6 to 17 years |
| Natives/Alaskans | 0.0 /100 | #333 | Tragic 11.5% |
| Ugandans | 0.0 /100 | #334 | Tragic 12.0% |
| Colville | 0.0 /100 | #335 | Tragic 12.3% |
| Houma | 0.0 /100 | #336 | Tragic 12.5% |
| Immigrants | Yemen | 0.0 /100 | #337 | Tragic 12.7% |
| Hopi | 0.0 /100 | #338 | Tragic 12.9% |
| Sioux | 0.0 /100 | #339 | Tragic 13.2% |
| Puerto Ricans | 0.0 /100 | #340 | Tragic 13.9% |
| Navajo | 0.0 /100 | #341 | Tragic 14.2% |
| Yuman | 0.0 /100 | #342 | Tragic 14.8% |
| Inupiat | 0.0 /100 | #343 | Tragic 14.9% |
| Cheyenne | 0.0 /100 | #344 | Tragic 16.4% |
| Arapaho | 0.0 /100 | #345 | Tragic 16.8% |
| Yup'ik | 0.0 /100 | #346 | Tragic 18.6% |
| Pima | 0.0 /100 | #347 | Tragic 18.9% |