Okinawan vs Guyanese Female Unemployment
COMPARE
Okinawan
Guyanese
Female Unemployment
Female Unemployment Comparison
Okinawans
Guyanese
4.9%
FEMALE UNEMPLOYMENT
99.3/ 100
METRIC RATING
47th/ 347
METRIC RANK
6.7%
FEMALE UNEMPLOYMENT
0.0/ 100
METRIC RATING
328th/ 347
METRIC RANK
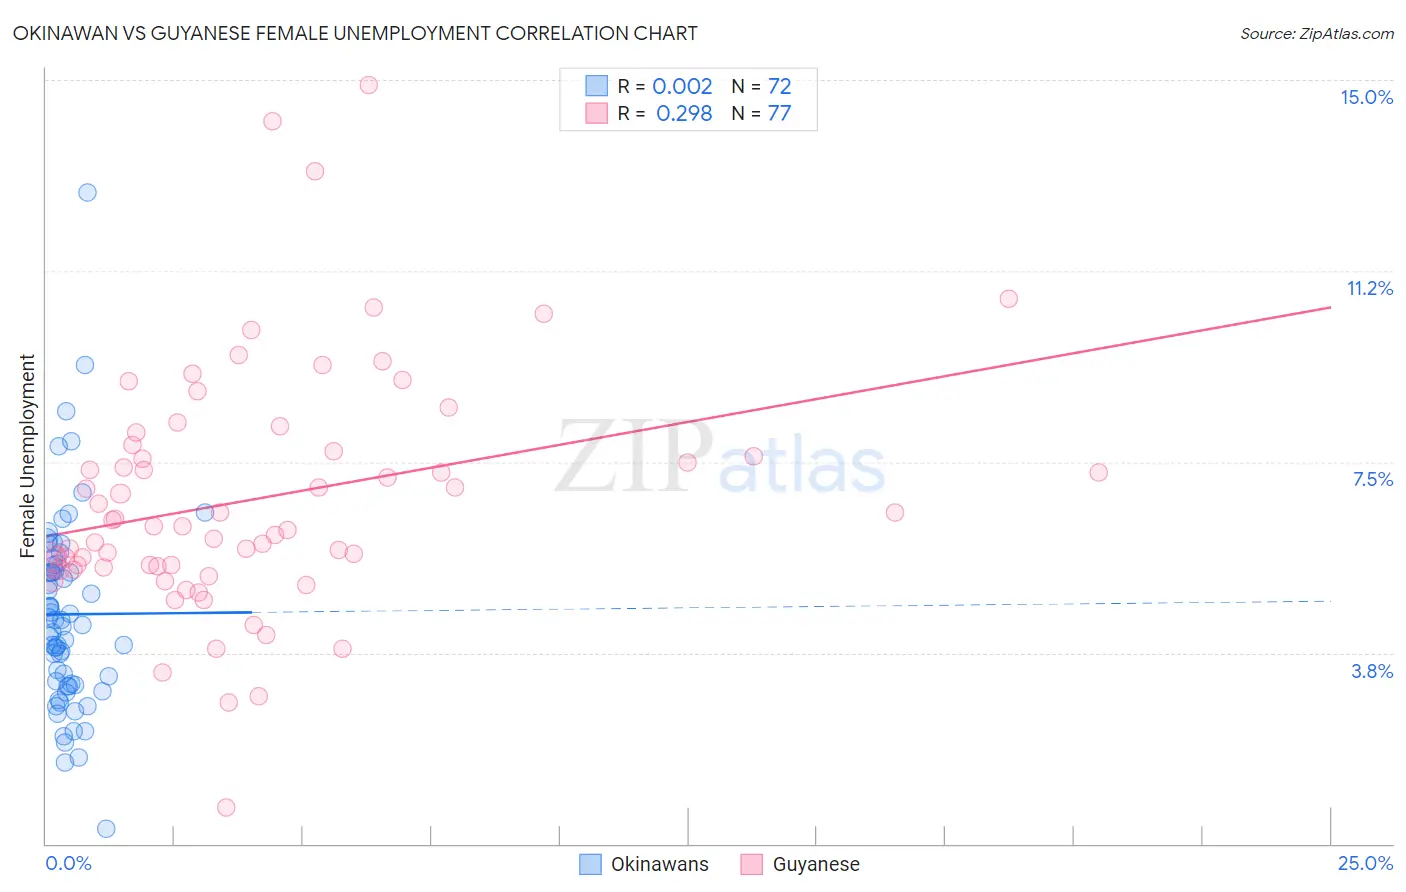
Okinawan vs Guyanese Female Unemployment Correlation Chart
The statistical analysis conducted on geographies consisting of 73,722,154 people shows no correlation between the proportion of Okinawans and unemploymnet rate among females in the United States with a correlation coefficient (R) of 0.002 and weighted average of 4.9%. Similarly, the statistical analysis conducted on geographies consisting of 176,676,067 people shows a weak positive correlation between the proportion of Guyanese and unemploymnet rate among females in the United States with a correlation coefficient (R) of 0.298 and weighted average of 6.7%, a difference of 36.9%.
Female Unemployment Correlation Summary
| Measurement | Okinawan | Guyanese |
| Minimum | 0.30% | 0.70% |
| Maximum | 12.8% | 14.9% |
| Range | 12.5% | 14.2% |
| Mean | 4.5% | 6.8% |
| Median | 4.3% | 6.2% |
| Interquartile 25% (IQ1) | 3.1% | 5.4% |
| Interquartile 75% (IQ3) | 5.4% | 7.8% |
| Interquartile Range (IQR) | 2.3% | 2.3% |
| Standard Deviation (Sample) | 1.9% | 2.4% |
| Standard Deviation (Population) | 1.9% | 2.4% |
Similar Demographics by Female Unemployment
Demographics Similar to Okinawans by Female Unemployment
In terms of female unemployment, the demographic groups most similar to Okinawans are Immigrants from Bulgaria (4.9%, a difference of 0.080%), Austrian (4.9%, a difference of 0.11%), Greek (4.9%, a difference of 0.19%), Thai (4.9%, a difference of 0.21%), and Australian (4.9%, a difference of 0.21%).
| Demographics | Rating | Rank | Female Unemployment |
| French | 99.6 /100 | #40 | Exceptional 4.8% |
| Tongans | 99.5 /100 | #41 | Exceptional 4.8% |
| Italians | 99.5 /100 | #42 | Exceptional 4.8% |
| Eastern Europeans | 99.4 /100 | #43 | Exceptional 4.9% |
| Greeks | 99.4 /100 | #44 | Exceptional 4.9% |
| Austrians | 99.3 /100 | #45 | Exceptional 4.9% |
| Immigrants | Bulgaria | 99.3 /100 | #46 | Exceptional 4.9% |
| Okinawans | 99.3 /100 | #47 | Exceptional 4.9% |
| Thais | 99.2 /100 | #48 | Exceptional 4.9% |
| Australians | 99.2 /100 | #49 | Exceptional 4.9% |
| Immigrants | Cuba | 99.1 /100 | #50 | Exceptional 4.9% |
| Cambodians | 99.1 /100 | #51 | Exceptional 4.9% |
| Slavs | 99.1 /100 | #52 | Exceptional 4.9% |
| Whites/Caucasians | 99.0 /100 | #53 | Exceptional 4.9% |
| Immigrants | Zimbabwe | 99.0 /100 | #54 | Exceptional 4.9% |
Demographics Similar to Guyanese by Female Unemployment
In terms of female unemployment, the demographic groups most similar to Guyanese are Immigrants from Guyana (6.7%, a difference of 0.37%), Alaska Native (6.6%, a difference of 0.44%), Native/Alaskan (6.6%, a difference of 0.52%), Yakama (6.7%, a difference of 0.94%), and Apache (6.6%, a difference of 1.1%).
| Demographics | Rating | Rank | Female Unemployment |
| Blacks/African Americans | 0.0 /100 | #321 | Tragic 6.5% |
| Vietnamese | 0.0 /100 | #322 | Tragic 6.5% |
| Immigrants | Belize | 0.0 /100 | #323 | Tragic 6.5% |
| Cheyenne | 0.0 /100 | #324 | Tragic 6.6% |
| Apache | 0.0 /100 | #325 | Tragic 6.6% |
| Natives/Alaskans | 0.0 /100 | #326 | Tragic 6.6% |
| Alaska Natives | 0.0 /100 | #327 | Tragic 6.6% |
| Guyanese | 0.0 /100 | #328 | Tragic 6.7% |
| Immigrants | Guyana | 0.0 /100 | #329 | Tragic 6.7% |
| Yakama | 0.0 /100 | #330 | Tragic 6.7% |
| Paiute | 0.0 /100 | #331 | Tragic 6.8% |
| Sioux | 0.0 /100 | #332 | Tragic 7.0% |
| Menominee | 0.0 /100 | #333 | Tragic 7.0% |
| Immigrants | Armenia | 0.0 /100 | #334 | Tragic 7.1% |
| Dominicans | 0.0 /100 | #335 | Tragic 7.2% |