Pennsylvania German vs Guyanese Female Unemployment
COMPARE
Pennsylvania German
Guyanese
Female Unemployment
Female Unemployment Comparison
Pennsylvania Germans
Guyanese
4.8%
FEMALE UNEMPLOYMENT
99.6/ 100
METRIC RATING
37th/ 347
METRIC RANK
6.7%
FEMALE UNEMPLOYMENT
0.0/ 100
METRIC RATING
328th/ 347
METRIC RANK
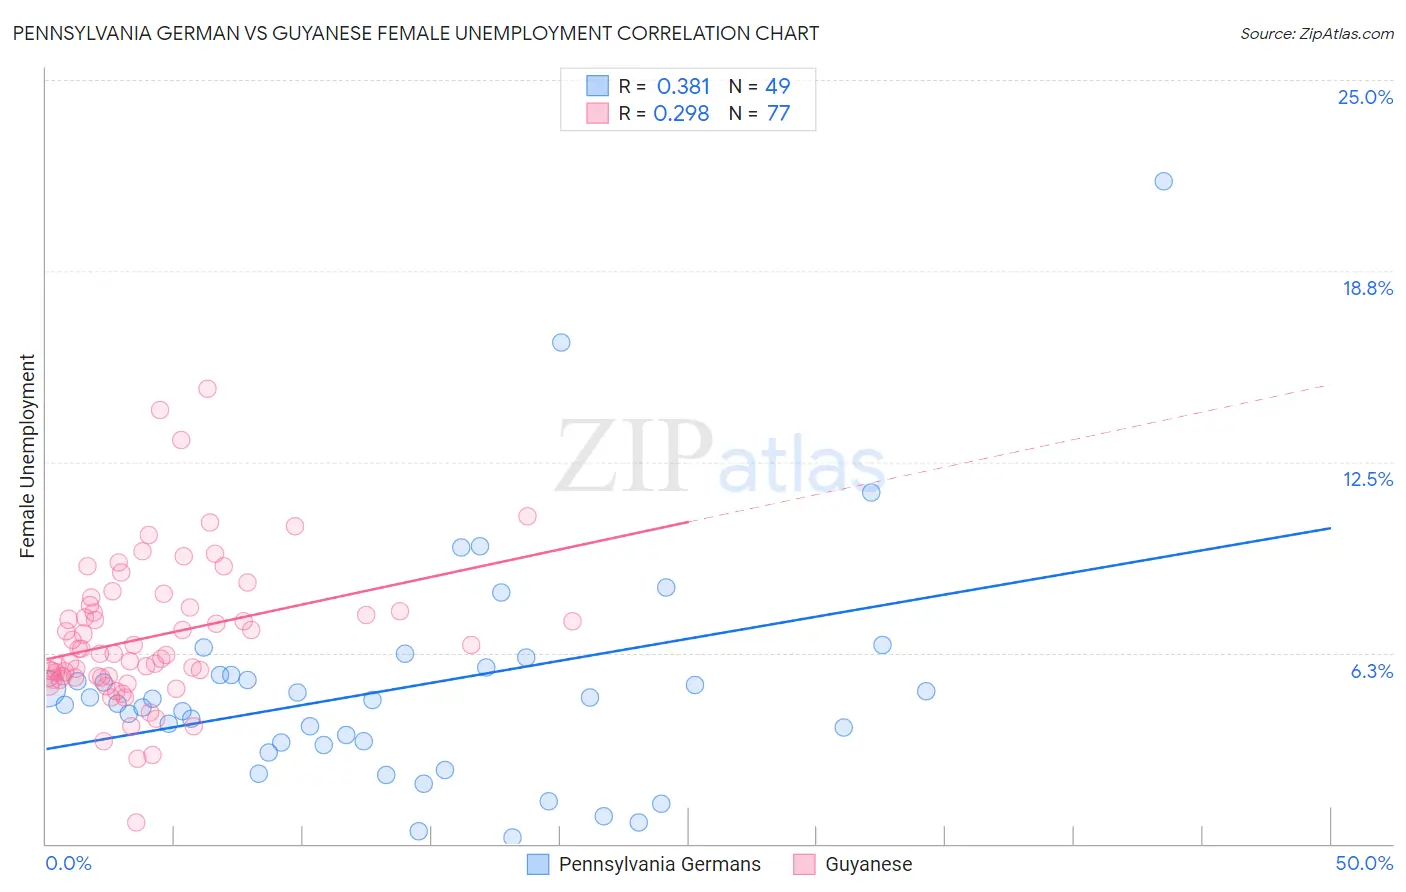
Pennsylvania German vs Guyanese Female Unemployment Correlation Chart
The statistical analysis conducted on geographies consisting of 232,382,723 people shows a mild positive correlation between the proportion of Pennsylvania Germans and unemploymnet rate among females in the United States with a correlation coefficient (R) of 0.381 and weighted average of 4.8%. Similarly, the statistical analysis conducted on geographies consisting of 176,676,067 people shows a weak positive correlation between the proportion of Guyanese and unemploymnet rate among females in the United States with a correlation coefficient (R) of 0.298 and weighted average of 6.7%, a difference of 38.3%.
Female Unemployment Correlation Summary
| Measurement | Pennsylvania German | Guyanese |
| Minimum | 0.20% | 0.70% |
| Maximum | 21.7% | 14.9% |
| Range | 21.5% | 14.2% |
| Mean | 5.1% | 6.8% |
| Median | 4.7% | 6.2% |
| Interquartile 25% (IQ1) | 3.3% | 5.4% |
| Interquartile 75% (IQ3) | 5.6% | 7.8% |
| Interquartile Range (IQR) | 2.4% | 2.3% |
| Standard Deviation (Sample) | 3.8% | 2.4% |
| Standard Deviation (Population) | 3.7% | 2.4% |
Similar Demographics by Female Unemployment
Demographics Similar to Pennsylvania Germans by Female Unemployment
In terms of female unemployment, the demographic groups most similar to Pennsylvania Germans are Northern European (4.8%, a difference of 0.11%), Scotch-Irish (4.8%, a difference of 0.12%), French (4.8%, a difference of 0.16%), Yugoslavian (4.8%, a difference of 0.36%), and Tongan (4.8%, a difference of 0.41%).
| Demographics | Rating | Rank | Female Unemployment |
| Lithuanians | 99.8 /100 | #30 | Exceptional 4.7% |
| Sudanese | 99.8 /100 | #31 | Exceptional 4.8% |
| Slovaks | 99.8 /100 | #32 | Exceptional 4.8% |
| Czechoslovakians | 99.7 /100 | #33 | Exceptional 4.8% |
| Zimbabweans | 99.7 /100 | #34 | Exceptional 4.8% |
| French Canadians | 99.7 /100 | #35 | Exceptional 4.8% |
| Yugoslavians | 99.7 /100 | #36 | Exceptional 4.8% |
| Pennsylvania Germans | 99.6 /100 | #37 | Exceptional 4.8% |
| Northern Europeans | 99.6 /100 | #38 | Exceptional 4.8% |
| Scotch-Irish | 99.6 /100 | #39 | Exceptional 4.8% |
| French | 99.6 /100 | #40 | Exceptional 4.8% |
| Tongans | 99.5 /100 | #41 | Exceptional 4.8% |
| Italians | 99.5 /100 | #42 | Exceptional 4.8% |
| Eastern Europeans | 99.4 /100 | #43 | Exceptional 4.9% |
| Greeks | 99.4 /100 | #44 | Exceptional 4.9% |
Demographics Similar to Guyanese by Female Unemployment
In terms of female unemployment, the demographic groups most similar to Guyanese are Immigrants from Guyana (6.7%, a difference of 0.37%), Alaska Native (6.6%, a difference of 0.44%), Native/Alaskan (6.6%, a difference of 0.52%), Yakama (6.7%, a difference of 0.94%), and Apache (6.6%, a difference of 1.1%).
| Demographics | Rating | Rank | Female Unemployment |
| Blacks/African Americans | 0.0 /100 | #321 | Tragic 6.5% |
| Vietnamese | 0.0 /100 | #322 | Tragic 6.5% |
| Immigrants | Belize | 0.0 /100 | #323 | Tragic 6.5% |
| Cheyenne | 0.0 /100 | #324 | Tragic 6.6% |
| Apache | 0.0 /100 | #325 | Tragic 6.6% |
| Natives/Alaskans | 0.0 /100 | #326 | Tragic 6.6% |
| Alaska Natives | 0.0 /100 | #327 | Tragic 6.6% |
| Guyanese | 0.0 /100 | #328 | Tragic 6.7% |
| Immigrants | Guyana | 0.0 /100 | #329 | Tragic 6.7% |
| Yakama | 0.0 /100 | #330 | Tragic 6.7% |
| Paiute | 0.0 /100 | #331 | Tragic 6.8% |
| Sioux | 0.0 /100 | #332 | Tragic 7.0% |
| Menominee | 0.0 /100 | #333 | Tragic 7.0% |
| Immigrants | Armenia | 0.0 /100 | #334 | Tragic 7.1% |
| Dominicans | 0.0 /100 | #335 | Tragic 7.2% |