Panamanian vs Guyanese Female Unemployment
COMPARE
Panamanian
Guyanese
Female Unemployment
Female Unemployment Comparison
Panamanians
Guyanese
5.5%
FEMALE UNEMPLOYMENT
4.7/ 100
METRIC RATING
229th/ 347
METRIC RANK
6.7%
FEMALE UNEMPLOYMENT
0.0/ 100
METRIC RATING
328th/ 347
METRIC RANK
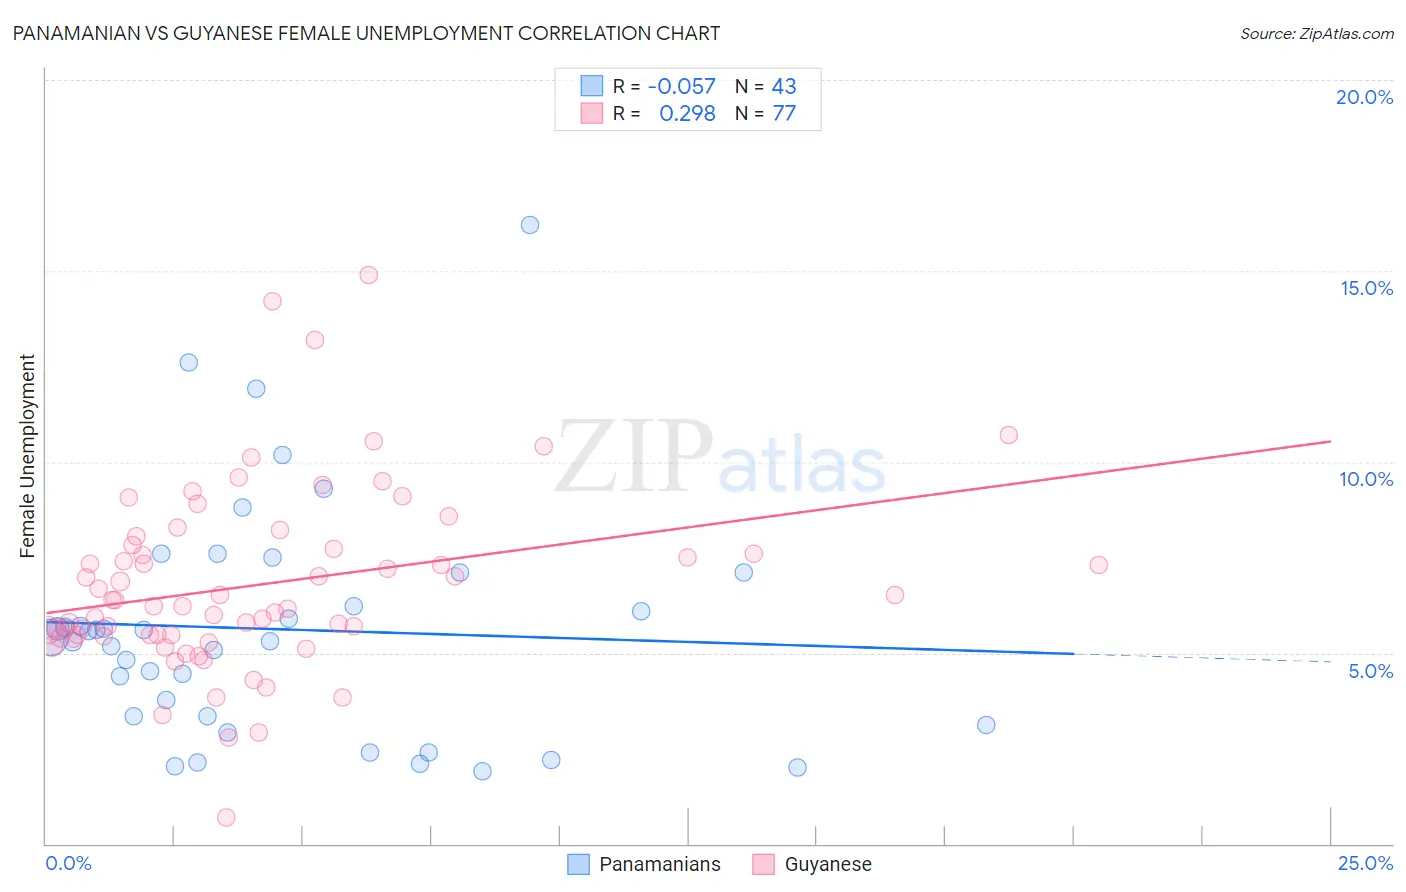
Panamanian vs Guyanese Female Unemployment Correlation Chart
The statistical analysis conducted on geographies consisting of 280,650,516 people shows a slight negative correlation between the proportion of Panamanians and unemploymnet rate among females in the United States with a correlation coefficient (R) of -0.057 and weighted average of 5.5%. Similarly, the statistical analysis conducted on geographies consisting of 176,676,067 people shows a weak positive correlation between the proportion of Guyanese and unemploymnet rate among females in the United States with a correlation coefficient (R) of 0.298 and weighted average of 6.7%, a difference of 21.2%.
Female Unemployment Correlation Summary
| Measurement | Panamanian | Guyanese |
| Minimum | 1.9% | 0.70% |
| Maximum | 16.2% | 14.9% |
| Range | 14.3% | 14.2% |
| Mean | 5.6% | 6.8% |
| Median | 5.4% | 6.2% |
| Interquartile 25% (IQ1) | 3.3% | 5.4% |
| Interquartile 75% (IQ3) | 7.1% | 7.8% |
| Interquartile Range (IQR) | 3.8% | 2.3% |
| Standard Deviation (Sample) | 3.1% | 2.4% |
| Standard Deviation (Population) | 3.0% | 2.4% |
Similar Demographics by Female Unemployment
Demographics Similar to Panamanians by Female Unemployment
In terms of female unemployment, the demographic groups most similar to Panamanians are Israeli (5.5%, a difference of 0.010%), Immigrants from Uruguay (5.5%, a difference of 0.010%), Immigrants from Philippines (5.5%, a difference of 0.17%), Immigrants from Iraq (5.5%, a difference of 0.28%), and Liberian (5.5%, a difference of 0.29%).
| Demographics | Rating | Rank | Female Unemployment |
| Nicaraguans | 7.2 /100 | #222 | Tragic 5.5% |
| Delaware | 7.2 /100 | #223 | Tragic 5.5% |
| Iraqis | 7.1 /100 | #224 | Tragic 5.5% |
| French American Indians | 6.1 /100 | #225 | Tragic 5.5% |
| Immigrants | Peru | 5.9 /100 | #226 | Tragic 5.5% |
| Immigrants | Philippines | 5.3 /100 | #227 | Tragic 5.5% |
| Israelis | 4.8 /100 | #228 | Tragic 5.5% |
| Panamanians | 4.7 /100 | #229 | Tragic 5.5% |
| Immigrants | Uruguay | 4.7 /100 | #230 | Tragic 5.5% |
| Immigrants | Iraq | 3.9 /100 | #231 | Tragic 5.5% |
| Liberians | 3.9 /100 | #232 | Tragic 5.5% |
| Moroccans | 3.4 /100 | #233 | Tragic 5.5% |
| Immigrants | Lebanon | 3.3 /100 | #234 | Tragic 5.5% |
| Immigrants | Iran | 3.3 /100 | #235 | Tragic 5.5% |
| Immigrants | Cambodia | 3.3 /100 | #236 | Tragic 5.5% |
Demographics Similar to Guyanese by Female Unemployment
In terms of female unemployment, the demographic groups most similar to Guyanese are Immigrants from Guyana (6.7%, a difference of 0.37%), Alaska Native (6.6%, a difference of 0.44%), Native/Alaskan (6.6%, a difference of 0.52%), Yakama (6.7%, a difference of 0.94%), and Apache (6.6%, a difference of 1.1%).
| Demographics | Rating | Rank | Female Unemployment |
| Blacks/African Americans | 0.0 /100 | #321 | Tragic 6.5% |
| Vietnamese | 0.0 /100 | #322 | Tragic 6.5% |
| Immigrants | Belize | 0.0 /100 | #323 | Tragic 6.5% |
| Cheyenne | 0.0 /100 | #324 | Tragic 6.6% |
| Apache | 0.0 /100 | #325 | Tragic 6.6% |
| Natives/Alaskans | 0.0 /100 | #326 | Tragic 6.6% |
| Alaska Natives | 0.0 /100 | #327 | Tragic 6.6% |
| Guyanese | 0.0 /100 | #328 | Tragic 6.7% |
| Immigrants | Guyana | 0.0 /100 | #329 | Tragic 6.7% |
| Yakama | 0.0 /100 | #330 | Tragic 6.7% |
| Paiute | 0.0 /100 | #331 | Tragic 6.8% |
| Sioux | 0.0 /100 | #332 | Tragic 7.0% |
| Menominee | 0.0 /100 | #333 | Tragic 7.0% |
| Immigrants | Armenia | 0.0 /100 | #334 | Tragic 7.1% |
| Dominicans | 0.0 /100 | #335 | Tragic 7.2% |