Immigrants from Kuwait vs Guyanese Female Unemployment
COMPARE
Immigrants from Kuwait
Guyanese
Female Unemployment
Female Unemployment Comparison
Immigrants from Kuwait
Guyanese
5.0%
FEMALE UNEMPLOYMENT
95.2/ 100
METRIC RATING
98th/ 347
METRIC RANK
6.7%
FEMALE UNEMPLOYMENT
0.0/ 100
METRIC RATING
328th/ 347
METRIC RANK
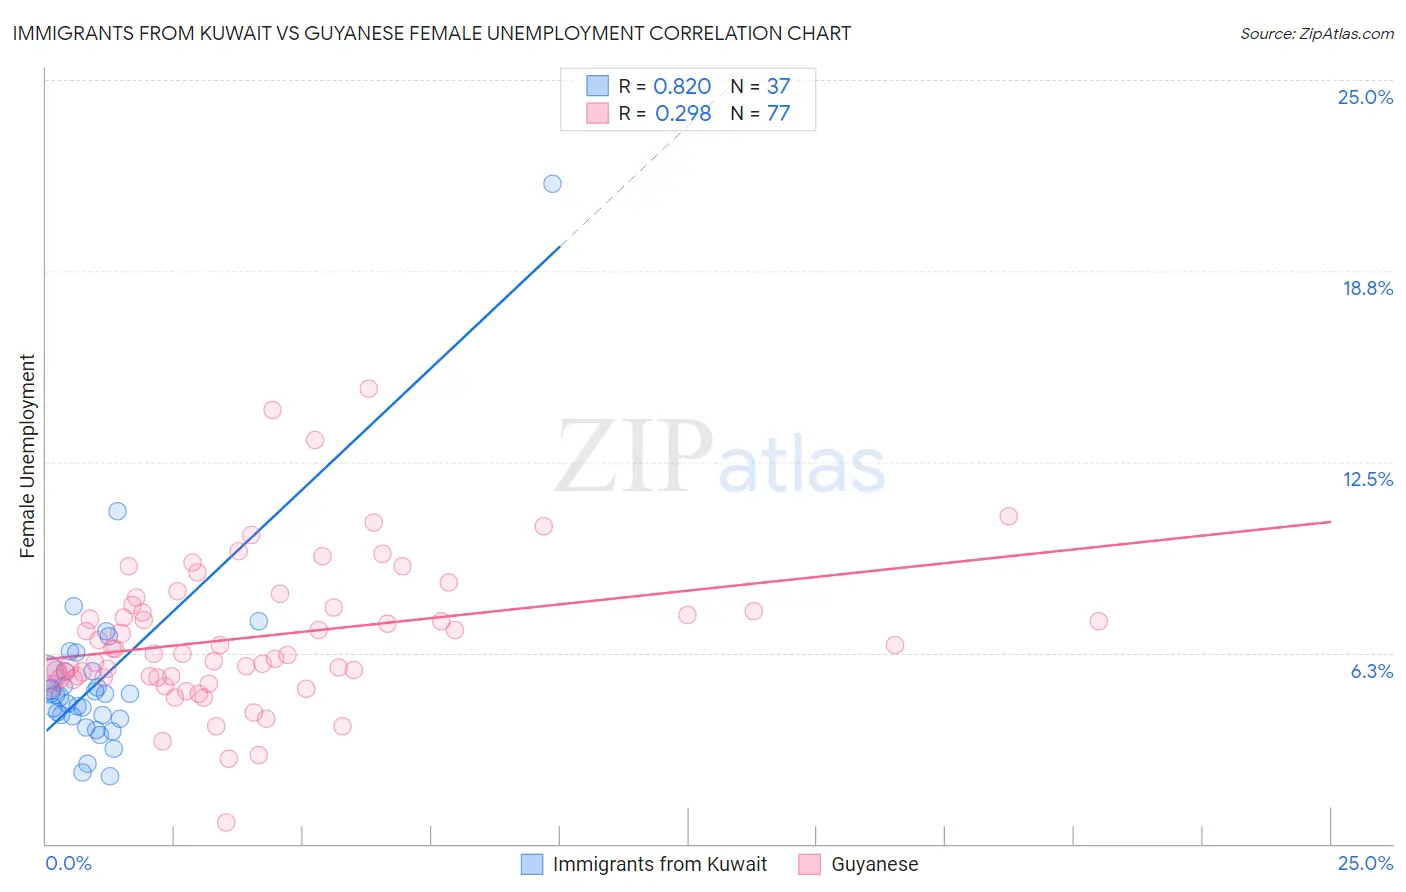
Immigrants from Kuwait vs Guyanese Female Unemployment Correlation Chart
The statistical analysis conducted on geographies consisting of 136,847,491 people shows a very strong positive correlation between the proportion of Immigrants from Kuwait and unemploymnet rate among females in the United States with a correlation coefficient (R) of 0.820 and weighted average of 5.0%. Similarly, the statistical analysis conducted on geographies consisting of 176,676,067 people shows a weak positive correlation between the proportion of Guyanese and unemploymnet rate among females in the United States with a correlation coefficient (R) of 0.298 and weighted average of 6.7%, a difference of 32.7%.
Female Unemployment Correlation Summary
| Measurement | Immigrants from Kuwait | Guyanese |
| Minimum | 2.2% | 0.70% |
| Maximum | 21.6% | 14.9% |
| Range | 19.4% | 14.2% |
| Mean | 5.4% | 6.8% |
| Median | 4.9% | 6.2% |
| Interquartile 25% (IQ1) | 4.1% | 5.4% |
| Interquartile 75% (IQ3) | 5.6% | 7.8% |
| Interquartile Range (IQR) | 1.5% | 2.3% |
| Standard Deviation (Sample) | 3.2% | 2.4% |
| Standard Deviation (Population) | 3.1% | 2.4% |
Similar Demographics by Female Unemployment
Demographics Similar to Immigrants from Kuwait by Female Unemployment
In terms of female unemployment, the demographic groups most similar to Immigrants from Kuwait are Immigrants from Somalia (5.0%, a difference of 0.0%), Immigrants from Zaire (5.0%, a difference of 0.010%), Indonesian (5.0%, a difference of 0.030%), Immigrants from Czechoslovakia (5.0%, a difference of 0.070%), and Immigrants from South Central Asia (5.0%, a difference of 0.11%).
| Demographics | Rating | Rank | Female Unemployment |
| Immigrants | Japan | 96.0 /100 | #91 | Exceptional 5.0% |
| Romanians | 95.9 /100 | #92 | Exceptional 5.0% |
| Immigrants | Austria | 95.7 /100 | #93 | Exceptional 5.0% |
| Immigrants | Malaysia | 95.7 /100 | #94 | Exceptional 5.0% |
| Burmese | 95.6 /100 | #95 | Exceptional 5.0% |
| Immigrants | South Central Asia | 95.5 /100 | #96 | Exceptional 5.0% |
| Immigrants | Somalia | 95.2 /100 | #97 | Exceptional 5.0% |
| Immigrants | Kuwait | 95.2 /100 | #98 | Exceptional 5.0% |
| Immigrants | Zaire | 95.2 /100 | #99 | Exceptional 5.0% |
| Indonesians | 95.1 /100 | #100 | Exceptional 5.0% |
| Immigrants | Czechoslovakia | 95.0 /100 | #101 | Exceptional 5.0% |
| Immigrants | Kenya | 94.8 /100 | #102 | Exceptional 5.0% |
| Somalis | 94.6 /100 | #103 | Exceptional 5.0% |
| Kenyans | 93.7 /100 | #104 | Exceptional 5.0% |
| Immigrants | England | 93.6 /100 | #105 | Exceptional 5.0% |
Demographics Similar to Guyanese by Female Unemployment
In terms of female unemployment, the demographic groups most similar to Guyanese are Immigrants from Guyana (6.7%, a difference of 0.37%), Alaska Native (6.6%, a difference of 0.44%), Native/Alaskan (6.6%, a difference of 0.52%), Yakama (6.7%, a difference of 0.94%), and Apache (6.6%, a difference of 1.1%).
| Demographics | Rating | Rank | Female Unemployment |
| Blacks/African Americans | 0.0 /100 | #321 | Tragic 6.5% |
| Vietnamese | 0.0 /100 | #322 | Tragic 6.5% |
| Immigrants | Belize | 0.0 /100 | #323 | Tragic 6.5% |
| Cheyenne | 0.0 /100 | #324 | Tragic 6.6% |
| Apache | 0.0 /100 | #325 | Tragic 6.6% |
| Natives/Alaskans | 0.0 /100 | #326 | Tragic 6.6% |
| Alaska Natives | 0.0 /100 | #327 | Tragic 6.6% |
| Guyanese | 0.0 /100 | #328 | Tragic 6.7% |
| Immigrants | Guyana | 0.0 /100 | #329 | Tragic 6.7% |
| Yakama | 0.0 /100 | #330 | Tragic 6.7% |
| Paiute | 0.0 /100 | #331 | Tragic 6.8% |
| Sioux | 0.0 /100 | #332 | Tragic 7.0% |
| Menominee | 0.0 /100 | #333 | Tragic 7.0% |
| Immigrants | Armenia | 0.0 /100 | #334 | Tragic 7.1% |
| Dominicans | 0.0 /100 | #335 | Tragic 7.2% |