Okinawan vs Filipino Female Unemployment
COMPARE
Okinawan
Filipino
Female Unemployment
Female Unemployment Comparison
Okinawans
Filipinos
4.9%
FEMALE UNEMPLOYMENT
99.3/ 100
METRIC RATING
47th/ 347
METRIC RANK
5.0%
FEMALE UNEMPLOYMENT
97.3/ 100
METRIC RATING
81st/ 347
METRIC RANK
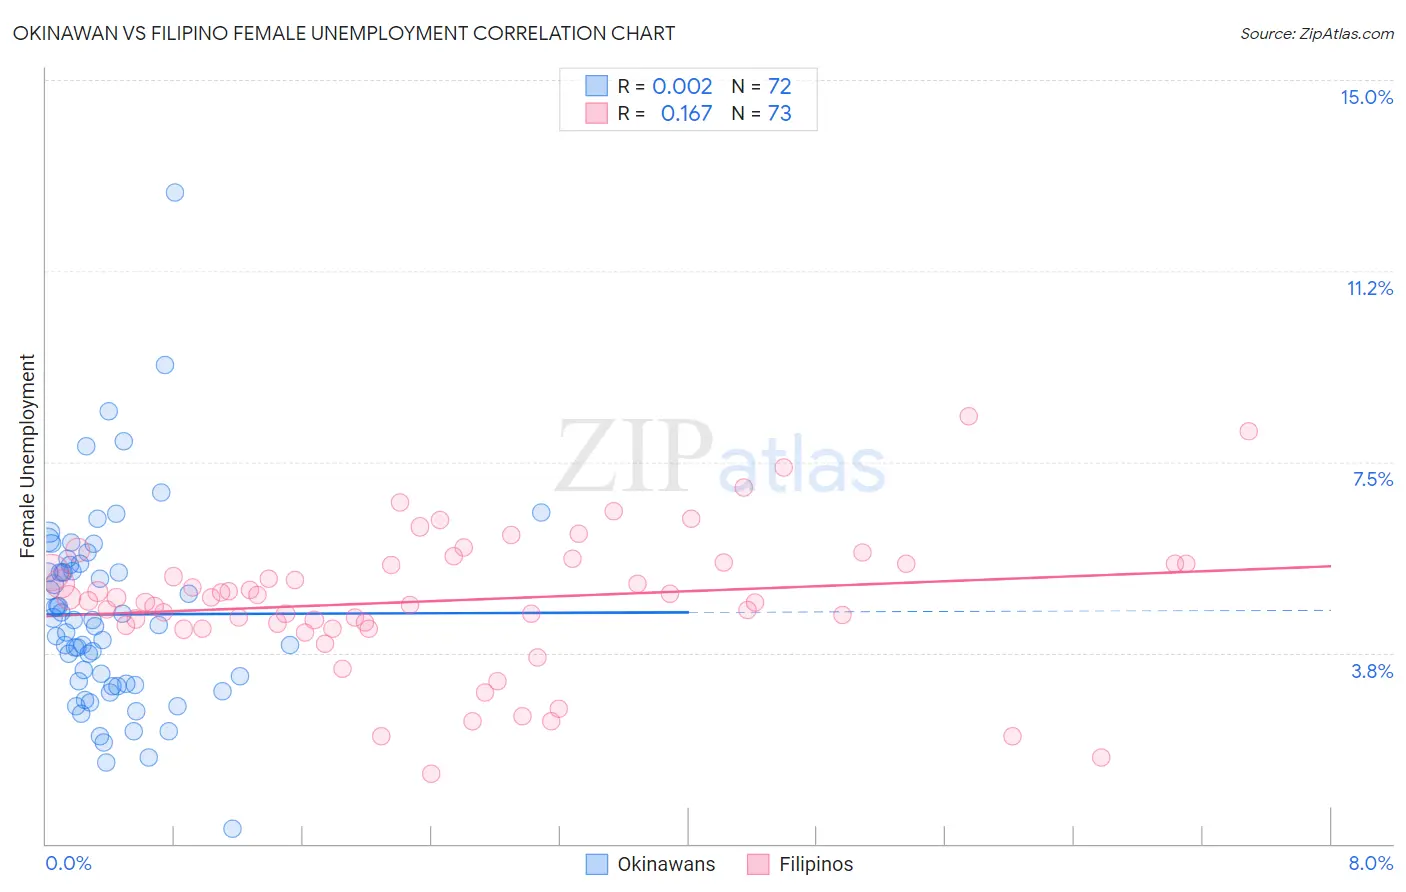
Okinawan vs Filipino Female Unemployment Correlation Chart
The statistical analysis conducted on geographies consisting of 73,722,154 people shows no correlation between the proportion of Okinawans and unemploymnet rate among females in the United States with a correlation coefficient (R) of 0.002 and weighted average of 4.9%. Similarly, the statistical analysis conducted on geographies consisting of 253,878,439 people shows a poor positive correlation between the proportion of Filipinos and unemploymnet rate among females in the United States with a correlation coefficient (R) of 0.167 and weighted average of 5.0%, a difference of 2.2%.
Female Unemployment Correlation Summary
| Measurement | Okinawan | Filipino |
| Minimum | 0.30% | 1.4% |
| Maximum | 12.8% | 8.4% |
| Range | 12.5% | 7.0% |
| Mean | 4.5% | 4.8% |
| Median | 4.3% | 4.8% |
| Interquartile 25% (IQ1) | 3.1% | 4.3% |
| Interquartile 75% (IQ3) | 5.4% | 5.5% |
| Interquartile Range (IQR) | 2.3% | 1.2% |
| Standard Deviation (Sample) | 1.9% | 1.3% |
| Standard Deviation (Population) | 1.9% | 1.3% |
Similar Demographics by Female Unemployment
Demographics Similar to Okinawans by Female Unemployment
In terms of female unemployment, the demographic groups most similar to Okinawans are Immigrants from Bulgaria (4.9%, a difference of 0.080%), Austrian (4.9%, a difference of 0.11%), Greek (4.9%, a difference of 0.19%), Thai (4.9%, a difference of 0.21%), and Australian (4.9%, a difference of 0.21%).
| Demographics | Rating | Rank | Female Unemployment |
| French | 99.6 /100 | #40 | Exceptional 4.8% |
| Tongans | 99.5 /100 | #41 | Exceptional 4.8% |
| Italians | 99.5 /100 | #42 | Exceptional 4.8% |
| Eastern Europeans | 99.4 /100 | #43 | Exceptional 4.9% |
| Greeks | 99.4 /100 | #44 | Exceptional 4.9% |
| Austrians | 99.3 /100 | #45 | Exceptional 4.9% |
| Immigrants | Bulgaria | 99.3 /100 | #46 | Exceptional 4.9% |
| Okinawans | 99.3 /100 | #47 | Exceptional 4.9% |
| Thais | 99.2 /100 | #48 | Exceptional 4.9% |
| Australians | 99.2 /100 | #49 | Exceptional 4.9% |
| Immigrants | Cuba | 99.1 /100 | #50 | Exceptional 4.9% |
| Cambodians | 99.1 /100 | #51 | Exceptional 4.9% |
| Slavs | 99.1 /100 | #52 | Exceptional 4.9% |
| Whites/Caucasians | 99.0 /100 | #53 | Exceptional 4.9% |
| Immigrants | Zimbabwe | 99.0 /100 | #54 | Exceptional 4.9% |
Demographics Similar to Filipinos by Female Unemployment
In terms of female unemployment, the demographic groups most similar to Filipinos are New Zealander (5.0%, a difference of 0.020%), Immigrants from Australia (5.0%, a difference of 0.050%), Immigrants from Serbia (5.0%, a difference of 0.070%), Canadian (5.0%, a difference of 0.10%), and Turkish (5.0%, a difference of 0.14%).
| Demographics | Rating | Rank | Female Unemployment |
| Immigrants | Bolivia | 98.0 /100 | #74 | Exceptional 5.0% |
| Immigrants | Singapore | 98.0 /100 | #75 | Exceptional 5.0% |
| Immigrants | Venezuela | 97.9 /100 | #76 | Exceptional 5.0% |
| Mongolians | 97.8 /100 | #77 | Exceptional 5.0% |
| Immigrants | Netherlands | 97.8 /100 | #78 | Exceptional 5.0% |
| Turks | 97.6 /100 | #79 | Exceptional 5.0% |
| New Zealanders | 97.4 /100 | #80 | Exceptional 5.0% |
| Filipinos | 97.3 /100 | #81 | Exceptional 5.0% |
| Immigrants | Australia | 97.3 /100 | #82 | Exceptional 5.0% |
| Immigrants | Serbia | 97.2 /100 | #83 | Exceptional 5.0% |
| Canadians | 97.2 /100 | #84 | Exceptional 5.0% |
| Ukrainians | 97.1 /100 | #85 | Exceptional 5.0% |
| Bolivians | 97.1 /100 | #86 | Exceptional 5.0% |
| Venezuelans | 96.9 /100 | #87 | Exceptional 5.0% |
| Immigrants | Sudan | 96.7 /100 | #88 | Exceptional 5.0% |