Norwegian vs Immigrants from Nicaragua Male Unemployment
COMPARE
Norwegian
Immigrants from Nicaragua
Male Unemployment
Male Unemployment Comparison
Norwegians
Immigrants from Nicaragua
4.4%
MALE UNEMPLOYMENT
100.0/ 100
METRIC RATING
3rd/ 347
METRIC RANK
5.1%
MALE UNEMPLOYMENT
91.2/ 100
METRIC RATING
108th/ 347
METRIC RANK
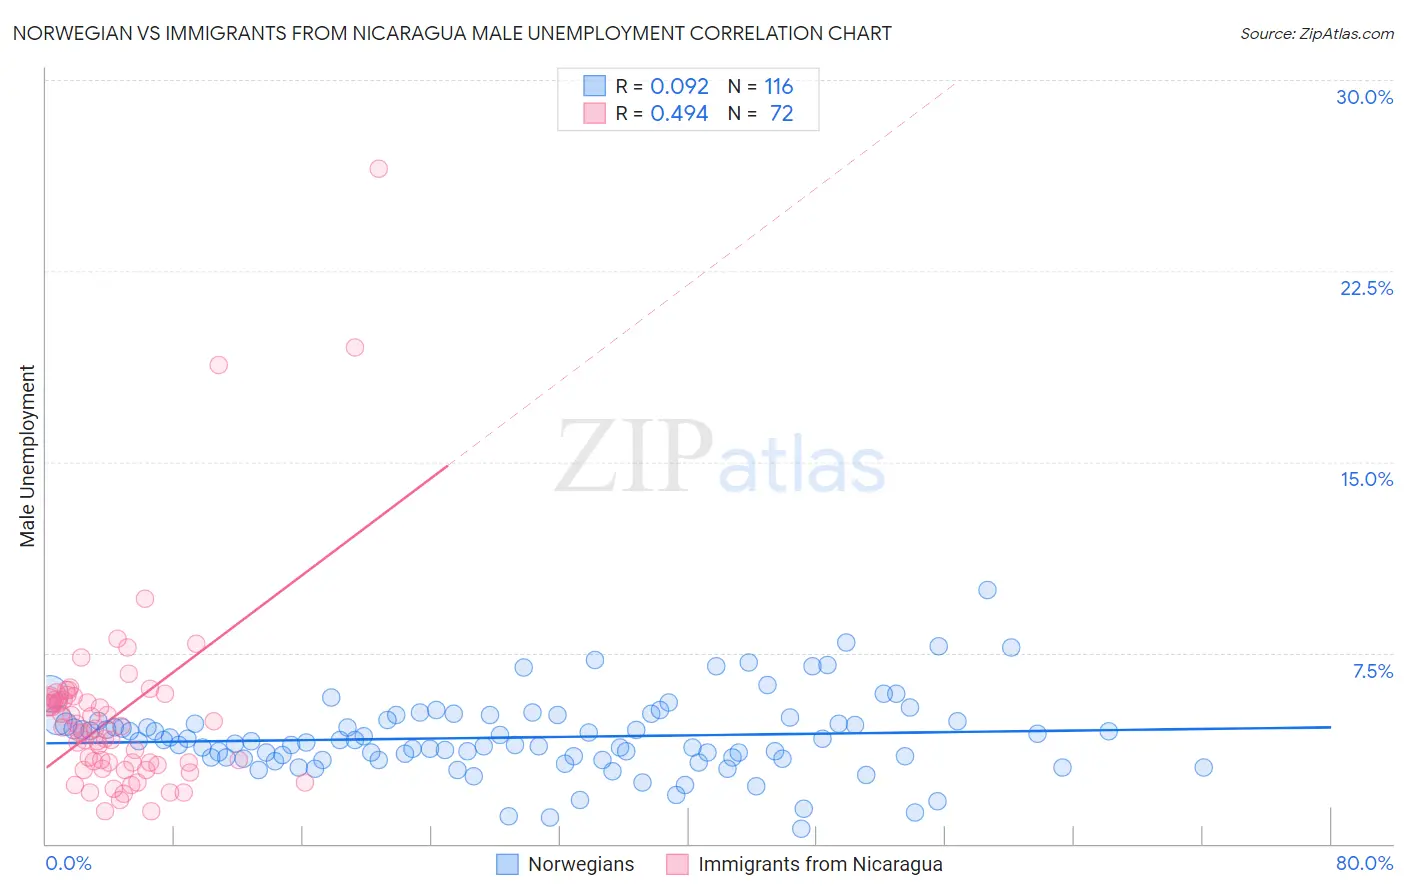
Norwegian vs Immigrants from Nicaragua Male Unemployment Correlation Chart
The statistical analysis conducted on geographies consisting of 525,648,173 people shows a slight positive correlation between the proportion of Norwegians and unemployment rate among males in the United States with a correlation coefficient (R) of 0.092 and weighted average of 4.4%. Similarly, the statistical analysis conducted on geographies consisting of 236,032,179 people shows a moderate positive correlation between the proportion of Immigrants from Nicaragua and unemployment rate among males in the United States with a correlation coefficient (R) of 0.494 and weighted average of 5.1%, a difference of 15.3%.
Male Unemployment Correlation Summary
| Measurement | Norwegian | Immigrants from Nicaragua |
| Minimum | 0.60% | 1.3% |
| Maximum | 10.0% | 26.5% |
| Range | 9.4% | 25.2% |
| Mean | 4.2% | 5.1% |
| Median | 4.0% | 4.5% |
| Interquartile 25% (IQ1) | 3.4% | 3.2% |
| Interquartile 75% (IQ3) | 4.8% | 5.7% |
| Interquartile Range (IQR) | 1.5% | 2.6% |
| Standard Deviation (Sample) | 1.5% | 3.9% |
| Standard Deviation (Population) | 1.5% | 3.9% |
Similar Demographics by Male Unemployment
Demographics Similar to Norwegians by Male Unemployment
In terms of male unemployment, the demographic groups most similar to Norwegians are Immigrants from Cuba (4.4%, a difference of 0.24%), Immigrants from Venezuela (4.4%, a difference of 0.33%), Immigrants from India (4.4%, a difference of 1.3%), Danish (4.5%, a difference of 1.4%), and Venezuelan (4.5%, a difference of 1.8%).
| Demographics | Rating | Rank | Male Unemployment |
| Immigrants | India | 100.0 /100 | #1 | Exceptional 4.4% |
| Immigrants | Cuba | 100.0 /100 | #2 | Exceptional 4.4% |
| Norwegians | 100.0 /100 | #3 | Exceptional 4.4% |
| Immigrants | Venezuela | 100.0 /100 | #4 | Exceptional 4.4% |
| Danes | 100.0 /100 | #5 | Exceptional 4.5% |
| Venezuelans | 100.0 /100 | #6 | Exceptional 4.5% |
| Czechs | 100.0 /100 | #7 | Exceptional 4.5% |
| Luxembourgers | 100.0 /100 | #8 | Exceptional 4.5% |
| Thais | 100.0 /100 | #9 | Exceptional 4.6% |
| Cubans | 100.0 /100 | #10 | Exceptional 4.6% |
| Swedes | 100.0 /100 | #11 | Exceptional 4.6% |
| Immigrants | Bolivia | 100.0 /100 | #12 | Exceptional 4.7% |
| Bolivians | 100.0 /100 | #13 | Exceptional 4.7% |
| Germans | 100.0 /100 | #14 | Exceptional 4.7% |
| Scandinavians | 100.0 /100 | #15 | Exceptional 4.7% |
Demographics Similar to Immigrants from Nicaragua by Male Unemployment
In terms of male unemployment, the demographic groups most similar to Immigrants from Nicaragua are Ethiopian (5.1%, a difference of 0.010%), Immigrants from Ethiopia (5.1%, a difference of 0.050%), Immigrants from Pakistan (5.1%, a difference of 0.060%), Immigrants from England (5.1%, a difference of 0.080%), and Immigrants from Czechoslovakia (5.1%, a difference of 0.090%).
| Demographics | Rating | Rank | Male Unemployment |
| German Russians | 92.7 /100 | #101 | Exceptional 5.1% |
| Immigrants | France | 92.7 /100 | #102 | Exceptional 5.1% |
| Immigrants | Jordan | 91.9 /100 | #103 | Exceptional 5.1% |
| Immigrants | Chile | 91.8 /100 | #104 | Exceptional 5.1% |
| Immigrants | Czechoslovakia | 91.7 /100 | #105 | Exceptional 5.1% |
| Immigrants | Ethiopia | 91.5 /100 | #106 | Exceptional 5.1% |
| Ethiopians | 91.3 /100 | #107 | Exceptional 5.1% |
| Immigrants | Nicaragua | 91.2 /100 | #108 | Exceptional 5.1% |
| Immigrants | Pakistan | 90.9 /100 | #109 | Exceptional 5.1% |
| Immigrants | England | 90.8 /100 | #110 | Exceptional 5.1% |
| Immigrants | Eastern Asia | 90.8 /100 | #111 | Exceptional 5.1% |
| Immigrants | Moldova | 90.3 /100 | #112 | Exceptional 5.1% |
| Immigrants | Austria | 90.3 /100 | #113 | Exceptional 5.1% |
| Romanians | 89.8 /100 | #114 | Excellent 5.1% |
| Immigrants | Asia | 89.6 /100 | #115 | Excellent 5.1% |