Immigrants from Sri Lanka vs Moroccan Male Unemployment
COMPARE
Immigrants from Sri Lanka
Moroccan
Male Unemployment
Male Unemployment Comparison
Immigrants from Sri Lanka
Moroccans
5.1%
MALE UNEMPLOYMENT
94.9/ 100
METRIC RATING
88th/ 347
METRIC RANK
5.6%
MALE UNEMPLOYMENT
1.6/ 100
METRIC RATING
232nd/ 347
METRIC RANK
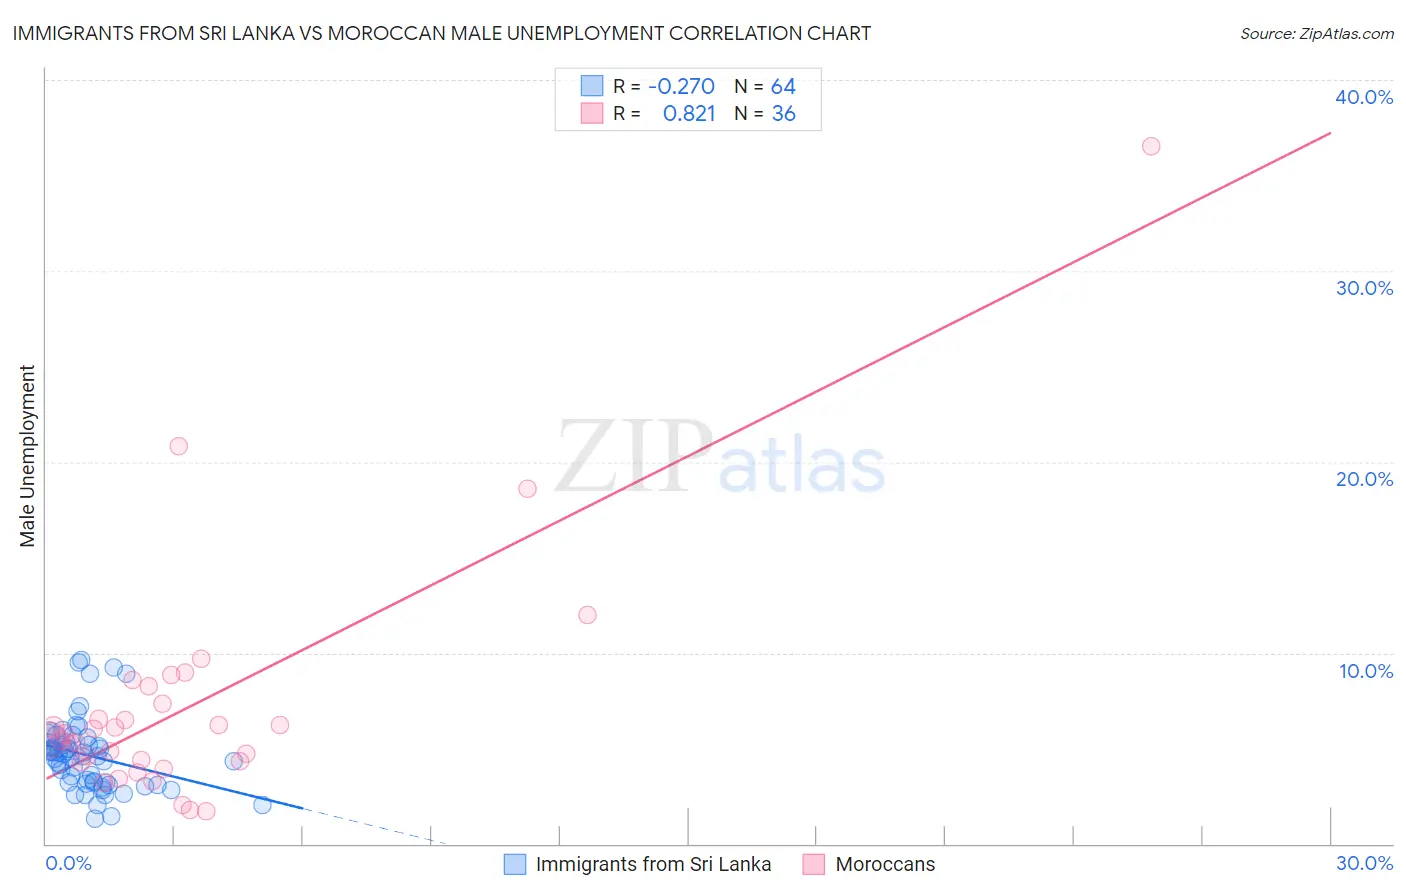
Immigrants from Sri Lanka vs Moroccan Male Unemployment Correlation Chart
The statistical analysis conducted on geographies consisting of 149,610,733 people shows a weak negative correlation between the proportion of Immigrants from Sri Lanka and unemployment rate among males in the United States with a correlation coefficient (R) of -0.270 and weighted average of 5.1%. Similarly, the statistical analysis conducted on geographies consisting of 201,559,646 people shows a very strong positive correlation between the proportion of Moroccans and unemployment rate among males in the United States with a correlation coefficient (R) of 0.821 and weighted average of 5.6%, a difference of 10.7%.
Male Unemployment Correlation Summary
| Measurement | Immigrants from Sri Lanka | Moroccan |
| Minimum | 1.3% | 1.7% |
| Maximum | 9.6% | 36.5% |
| Range | 8.3% | 34.8% |
| Mean | 4.6% | 7.2% |
| Median | 4.6% | 5.6% |
| Interquartile 25% (IQ1) | 3.2% | 4.3% |
| Interquartile 75% (IQ3) | 5.3% | 7.8% |
| Interquartile Range (IQR) | 2.1% | 3.5% |
| Standard Deviation (Sample) | 1.9% | 6.4% |
| Standard Deviation (Population) | 1.8% | 6.3% |
Similar Demographics by Male Unemployment
Demographics Similar to Immigrants from Sri Lanka by Male Unemployment
In terms of male unemployment, the demographic groups most similar to Immigrants from Sri Lanka are Immigrants from Australia (5.1%, a difference of 0.040%), Okinawan (5.1%, a difference of 0.040%), Immigrants from Turkey (5.1%, a difference of 0.13%), Slavic (5.1%, a difference of 0.18%), and Immigrants from Serbia (5.1%, a difference of 0.18%).
| Demographics | Rating | Rank | Male Unemployment |
| French | 96.2 /100 | #81 | Exceptional 5.0% |
| Chileans | 96.2 /100 | #82 | Exceptional 5.0% |
| Immigrants | Eritrea | 96.0 /100 | #83 | Exceptional 5.0% |
| Serbians | 95.7 /100 | #84 | Exceptional 5.1% |
| Immigrants | North Macedonia | 95.6 /100 | #85 | Exceptional 5.1% |
| Maltese | 95.5 /100 | #86 | Exceptional 5.1% |
| Immigrants | Romania | 95.4 /100 | #87 | Exceptional 5.1% |
| Immigrants | Sri Lanka | 94.9 /100 | #88 | Exceptional 5.1% |
| Immigrants | Australia | 94.7 /100 | #89 | Exceptional 5.1% |
| Okinawans | 94.7 /100 | #90 | Exceptional 5.1% |
| Immigrants | Turkey | 94.4 /100 | #91 | Exceptional 5.1% |
| Slavs | 94.2 /100 | #92 | Exceptional 5.1% |
| Immigrants | Serbia | 94.2 /100 | #93 | Exceptional 5.1% |
| Canadians | 94.1 /100 | #94 | Exceptional 5.1% |
| Italians | 93.8 /100 | #95 | Exceptional 5.1% |
Demographics Similar to Moroccans by Male Unemployment
In terms of male unemployment, the demographic groups most similar to Moroccans are Choctaw (5.6%, a difference of 0.030%), Somali (5.6%, a difference of 0.080%), Immigrants from Somalia (5.6%, a difference of 0.080%), Immigrants from Africa (5.6%, a difference of 0.090%), and Immigrants from Honduras (5.6%, a difference of 0.11%).
| Demographics | Rating | Rank | Male Unemployment |
| Panamanians | 1.9 /100 | #225 | Tragic 5.6% |
| Immigrants | Cambodia | 1.8 /100 | #226 | Tragic 5.6% |
| Immigrants | Panama | 1.8 /100 | #227 | Tragic 5.6% |
| Seminole | 1.8 /100 | #228 | Tragic 5.6% |
| Central Americans | 1.8 /100 | #229 | Tragic 5.6% |
| Immigrants | Africa | 1.7 /100 | #230 | Tragic 5.6% |
| Choctaw | 1.6 /100 | #231 | Tragic 5.6% |
| Moroccans | 1.6 /100 | #232 | Tragic 5.6% |
| Somalis | 1.5 /100 | #233 | Tragic 5.6% |
| Immigrants | Somalia | 1.5 /100 | #234 | Tragic 5.6% |
| Immigrants | Honduras | 1.5 /100 | #235 | Tragic 5.6% |
| Guatemalans | 1.2 /100 | #236 | Tragic 5.6% |
| Hondurans | 1.1 /100 | #237 | Tragic 5.6% |
| Native Hawaiians | 1.1 /100 | #238 | Tragic 5.6% |
| Immigrants | Guatemala | 1.1 /100 | #239 | Tragic 5.6% |