Norwegian vs Scotch-Irish Male Unemployment
COMPARE
Norwegian
Scotch-Irish
Male Unemployment
Male Unemployment Comparison
Norwegians
Scotch-Irish
4.4%
MALE UNEMPLOYMENT
100.0/ 100
METRIC RATING
3rd/ 347
METRIC RANK
4.9%
MALE UNEMPLOYMENT
99.4/ 100
METRIC RATING
37th/ 347
METRIC RANK
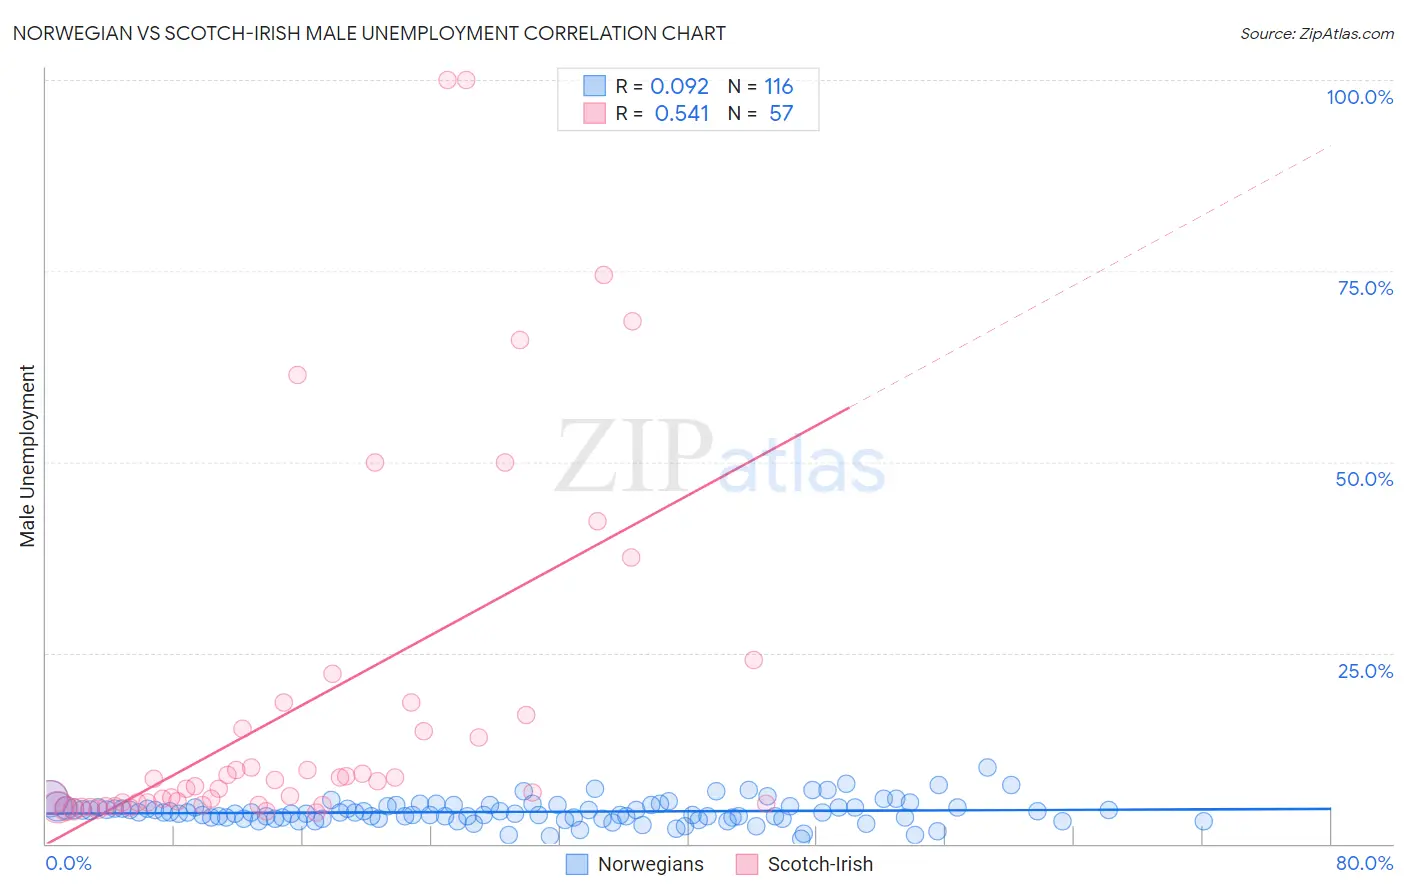
Norwegian vs Scotch-Irish Male Unemployment Correlation Chart
The statistical analysis conducted on geographies consisting of 525,648,173 people shows a slight positive correlation between the proportion of Norwegians and unemployment rate among males in the United States with a correlation coefficient (R) of 0.092 and weighted average of 4.4%. Similarly, the statistical analysis conducted on geographies consisting of 539,618,671 people shows a substantial positive correlation between the proportion of Scotch-Irish and unemployment rate among males in the United States with a correlation coefficient (R) of 0.541 and weighted average of 4.9%, a difference of 10.6%.
Male Unemployment Correlation Summary
| Measurement | Norwegian | Scotch-Irish |
| Minimum | 0.60% | 4.1% |
| Maximum | 10.0% | 100.0% |
| Range | 9.4% | 95.9% |
| Mean | 4.2% | 18.3% |
| Median | 4.0% | 8.2% |
| Interquartile 25% (IQ1) | 3.4% | 5.2% |
| Interquartile 75% (IQ3) | 4.8% | 17.7% |
| Interquartile Range (IQR) | 1.5% | 12.5% |
| Standard Deviation (Sample) | 1.5% | 23.8% |
| Standard Deviation (Population) | 1.5% | 23.6% |
Similar Demographics by Male Unemployment
Demographics Similar to Norwegians by Male Unemployment
In terms of male unemployment, the demographic groups most similar to Norwegians are Immigrants from Cuba (4.4%, a difference of 0.24%), Immigrants from Venezuela (4.4%, a difference of 0.33%), Immigrants from India (4.4%, a difference of 1.3%), Danish (4.5%, a difference of 1.4%), and Venezuelan (4.5%, a difference of 1.8%).
| Demographics | Rating | Rank | Male Unemployment |
| Immigrants | India | 100.0 /100 | #1 | Exceptional 4.4% |
| Immigrants | Cuba | 100.0 /100 | #2 | Exceptional 4.4% |
| Norwegians | 100.0 /100 | #3 | Exceptional 4.4% |
| Immigrants | Venezuela | 100.0 /100 | #4 | Exceptional 4.4% |
| Danes | 100.0 /100 | #5 | Exceptional 4.5% |
| Venezuelans | 100.0 /100 | #6 | Exceptional 4.5% |
| Czechs | 100.0 /100 | #7 | Exceptional 4.5% |
| Luxembourgers | 100.0 /100 | #8 | Exceptional 4.5% |
| Thais | 100.0 /100 | #9 | Exceptional 4.6% |
| Cubans | 100.0 /100 | #10 | Exceptional 4.6% |
| Swedes | 100.0 /100 | #11 | Exceptional 4.6% |
| Immigrants | Bolivia | 100.0 /100 | #12 | Exceptional 4.7% |
| Bolivians | 100.0 /100 | #13 | Exceptional 4.7% |
| Germans | 100.0 /100 | #14 | Exceptional 4.7% |
| Scandinavians | 100.0 /100 | #15 | Exceptional 4.7% |
Demographics Similar to Scotch-Irish by Male Unemployment
In terms of male unemployment, the demographic groups most similar to Scotch-Irish are Immigrants from Bosnia and Herzegovina (4.9%, a difference of 0.020%), Burmese (4.9%, a difference of 0.090%), Northern European (4.9%, a difference of 0.17%), Immigrants from Singapore (4.9%, a difference of 0.21%), and Chinese (4.9%, a difference of 0.26%).
| Demographics | Rating | Rank | Male Unemployment |
| British | 99.8 /100 | #30 | Exceptional 4.8% |
| Sudanese | 99.8 /100 | #31 | Exceptional 4.8% |
| Immigrants | Nepal | 99.8 /100 | #32 | Exceptional 4.8% |
| Latvians | 99.7 /100 | #33 | Exceptional 4.8% |
| Welsh | 99.7 /100 | #34 | Exceptional 4.8% |
| Paraguayans | 99.5 /100 | #35 | Exceptional 4.9% |
| Immigrants | Singapore | 99.4 /100 | #36 | Exceptional 4.9% |
| Scotch-Irish | 99.4 /100 | #37 | Exceptional 4.9% |
| Immigrants | Bosnia and Herzegovina | 99.4 /100 | #38 | Exceptional 4.9% |
| Burmese | 99.3 /100 | #39 | Exceptional 4.9% |
| Northern Europeans | 99.3 /100 | #40 | Exceptional 4.9% |
| Chinese | 99.3 /100 | #41 | Exceptional 4.9% |
| Immigrants | Belgium | 99.2 /100 | #42 | Exceptional 4.9% |
| Immigrants | Japan | 99.2 /100 | #43 | Exceptional 4.9% |
| Immigrants | Korea | 99.1 /100 | #44 | Exceptional 4.9% |