Norwegian vs Immigrants from Indonesia Unemployment Among Women with Children Ages 6 to 17 years
COMPARE
Norwegian
Immigrants from Indonesia
Unemployment Among Women with Children Ages 6 to 17 years
Unemployment Among Women with Children Ages 6 to 17 years Comparison
Norwegians
Immigrants from Indonesia
8.3%
UNEMPLOYMENT AMONG WOMEN WITH CHILDREN AGES 6 TO 17 YEARS
99.9/ 100
METRIC RATING
70th/ 347
METRIC RANK
7.7%
UNEMPLOYMENT AMONG WOMEN WITH CHILDREN AGES 6 TO 17 YEARS
100.0/ 100
METRIC RATING
23rd/ 347
METRIC RANK
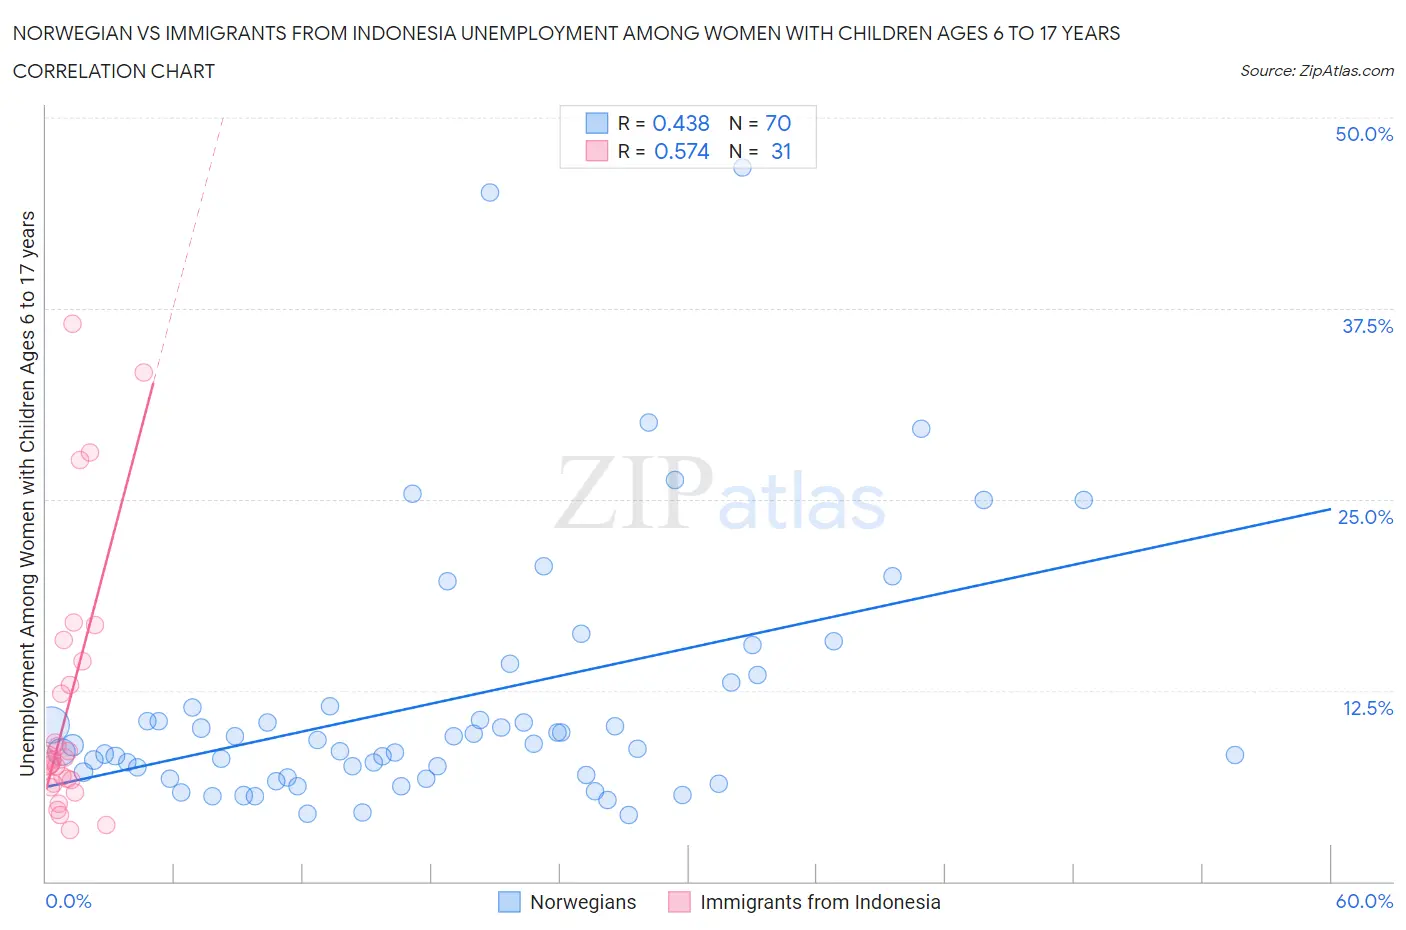
Norwegian vs Immigrants from Indonesia Unemployment Among Women with Children Ages 6 to 17 years Correlation Chart
The statistical analysis conducted on geographies consisting of 341,583,618 people shows a moderate positive correlation between the proportion of Norwegians and unemployment rate among women with children between the ages 6 and 17 in the United States with a correlation coefficient (R) of 0.438 and weighted average of 8.3%. Similarly, the statistical analysis conducted on geographies consisting of 175,361,002 people shows a substantial positive correlation between the proportion of Immigrants from Indonesia and unemployment rate among women with children between the ages 6 and 17 in the United States with a correlation coefficient (R) of 0.574 and weighted average of 7.7%, a difference of 7.7%.
Unemployment Among Women with Children Ages 6 to 17 years Correlation Summary
| Measurement | Norwegian | Immigrants from Indonesia |
| Minimum | 4.3% | 3.4% |
| Maximum | 46.7% | 36.5% |
| Range | 42.4% | 33.1% |
| Mean | 11.8% | 11.5% |
| Median | 8.9% | 7.9% |
| Interquartile 25% (IQ1) | 6.9% | 6.4% |
| Interquartile 75% (IQ3) | 11.4% | 14.4% |
| Interquartile Range (IQR) | 4.5% | 8.0% |
| Standard Deviation (Sample) | 8.5% | 8.7% |
| Standard Deviation (Population) | 8.4% | 8.5% |
Similar Demographics by Unemployment Among Women with Children Ages 6 to 17 years
Demographics Similar to Norwegians by Unemployment Among Women with Children Ages 6 to 17 years
In terms of unemployment among women with children ages 6 to 17 years, the demographic groups most similar to Norwegians are Immigrants from Australia (8.3%, a difference of 0.060%), Immigrants from Thailand (8.3%, a difference of 0.080%), Immigrants from Nepal (8.3%, a difference of 0.10%), Marshallese (8.3%, a difference of 0.11%), and Armenian (8.3%, a difference of 0.19%).
| Demographics | Rating | Rank | Unemployment Among Women with Children Ages 6 to 17 years |
| Immigrants | South Eastern Asia | 99.9 /100 | #63 | Exceptional 8.2% |
| Immigrants | Kuwait | 99.9 /100 | #64 | Exceptional 8.3% |
| Immigrants | Albania | 99.9 /100 | #65 | Exceptional 8.3% |
| Luxembourgers | 99.9 /100 | #66 | Exceptional 8.3% |
| Armenians | 99.9 /100 | #67 | Exceptional 8.3% |
| Marshallese | 99.9 /100 | #68 | Exceptional 8.3% |
| Immigrants | Thailand | 99.9 /100 | #69 | Exceptional 8.3% |
| Norwegians | 99.9 /100 | #70 | Exceptional 8.3% |
| Immigrants | Australia | 99.8 /100 | #71 | Exceptional 8.3% |
| Immigrants | Nepal | 99.8 /100 | #72 | Exceptional 8.3% |
| Spanish Americans | 99.8 /100 | #73 | Exceptional 8.4% |
| Samoans | 99.7 /100 | #74 | Exceptional 8.4% |
| Immigrants | Sri Lanka | 99.7 /100 | #75 | Exceptional 8.4% |
| Immigrants | Moldova | 99.7 /100 | #76 | Exceptional 8.4% |
| Iraqis | 99.7 /100 | #77 | Exceptional 8.4% |
Demographics Similar to Immigrants from Indonesia by Unemployment Among Women with Children Ages 6 to 17 years
In terms of unemployment among women with children ages 6 to 17 years, the demographic groups most similar to Immigrants from Indonesia are Nepalese (7.7%, a difference of 0.010%), Immigrants from Eastern Asia (7.7%, a difference of 0.13%), Indian (Asian) (7.7%, a difference of 0.13%), Immigrants from China (7.7%, a difference of 0.38%), and Immigrants from India (7.7%, a difference of 0.68%).
| Demographics | Rating | Rank | Unemployment Among Women with Children Ages 6 to 17 years |
| Immigrants | Burma/Myanmar | 100.0 /100 | #16 | Exceptional 7.5% |
| Cambodians | 100.0 /100 | #17 | Exceptional 7.5% |
| Afghans | 100.0 /100 | #18 | Exceptional 7.6% |
| Filipinos | 100.0 /100 | #19 | Exceptional 7.6% |
| Immigrants | Singapore | 100.0 /100 | #20 | Exceptional 7.7% |
| Immigrants | India | 100.0 /100 | #21 | Exceptional 7.7% |
| Immigrants | China | 100.0 /100 | #22 | Exceptional 7.7% |
| Immigrants | Indonesia | 100.0 /100 | #23 | Exceptional 7.7% |
| Nepalese | 100.0 /100 | #24 | Exceptional 7.7% |
| Immigrants | Eastern Asia | 100.0 /100 | #25 | Exceptional 7.7% |
| Indians (Asian) | 100.0 /100 | #26 | Exceptional 7.7% |
| Immigrants | Afghanistan | 100.0 /100 | #27 | Exceptional 7.8% |
| Immigrants | Uzbekistan | 100.0 /100 | #28 | Exceptional 7.8% |
| Thais | 100.0 /100 | #29 | Exceptional 7.8% |
| Immigrants | Iran | 100.0 /100 | #30 | Exceptional 7.9% |