Nigerian vs West Indian In Labor Force | Age 20-64
COMPARE
Nigerian
West Indian
In Labor Force | Age 20-64
In Labor Force | Age 20-64 Comparison
Nigerians
West Indians
79.7%
IN LABOR FORCE | AGE 20-64
64.0/ 100
METRIC RATING
165th/ 347
METRIC RANK
78.3%
IN LABOR FORCE | AGE 20-64
0.0/ 100
METRIC RATING
268th/ 347
METRIC RANK
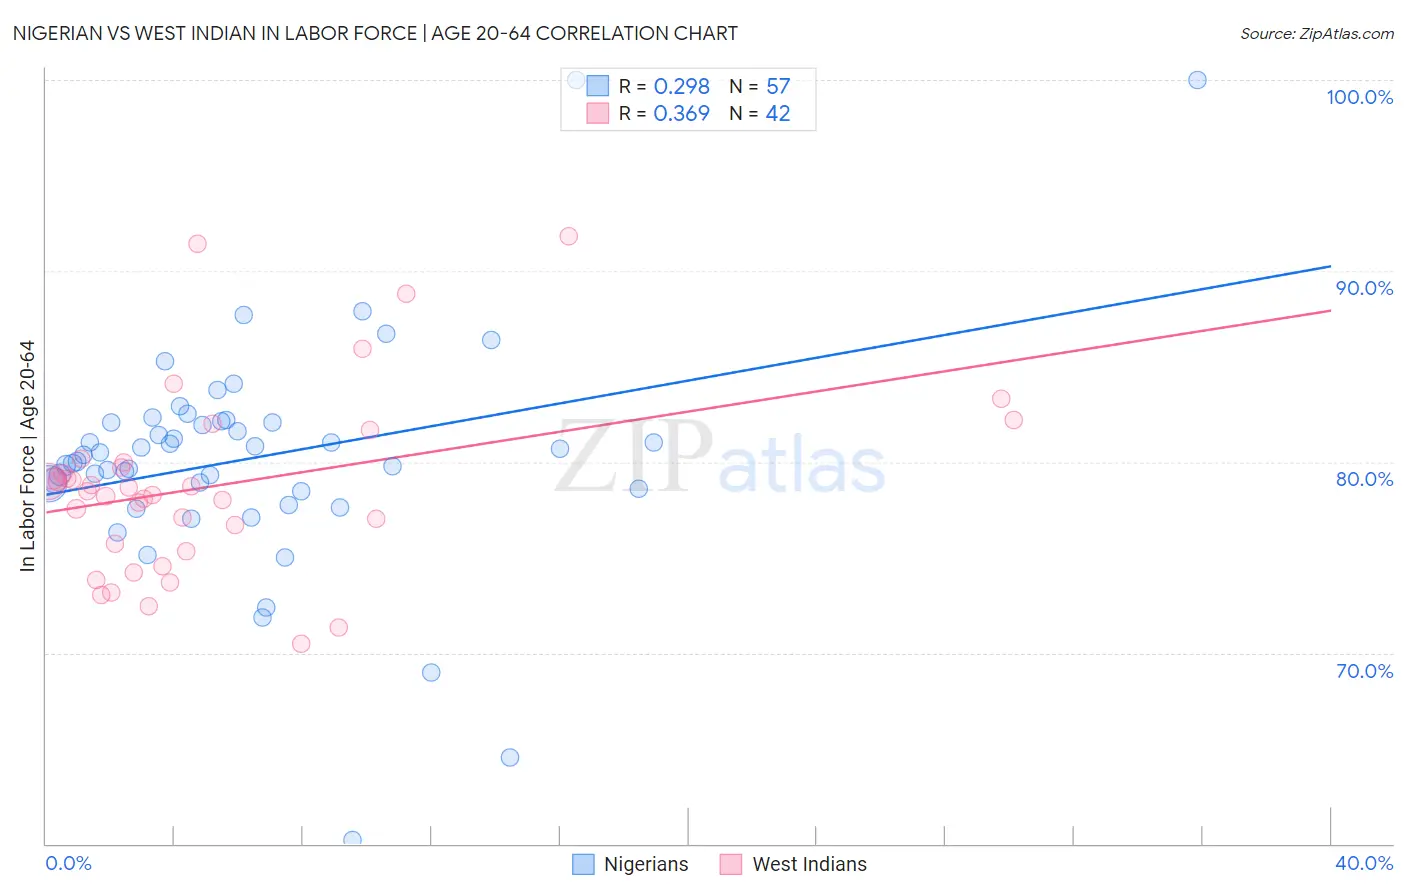
Nigerian vs West Indian In Labor Force | Age 20-64 Correlation Chart
The statistical analysis conducted on geographies consisting of 332,789,973 people shows a weak positive correlation between the proportion of Nigerians and labor force participation rate among population between the ages 20 and 64 in the United States with a correlation coefficient (R) of 0.298 and weighted average of 79.7%. Similarly, the statistical analysis conducted on geographies consisting of 254,049,696 people shows a mild positive correlation between the proportion of West Indians and labor force participation rate among population between the ages 20 and 64 in the United States with a correlation coefficient (R) of 0.369 and weighted average of 78.3%, a difference of 1.7%.
In Labor Force | Age 20-64 Correlation Summary
| Measurement | Nigerian | West Indian |
| Minimum | 60.2% | 70.5% |
| Maximum | 100.0% | 91.8% |
| Range | 39.8% | 21.3% |
| Mean | 80.2% | 78.7% |
| Median | 80.4% | 78.6% |
| Interquartile 25% (IQ1) | 78.5% | 75.7% |
| Interquartile 75% (IQ3) | 82.1% | 80.0% |
| Interquartile Range (IQR) | 3.6% | 4.3% |
| Standard Deviation (Sample) | 6.1% | 4.7% |
| Standard Deviation (Population) | 6.1% | 4.7% |
Similar Demographics by In Labor Force | Age 20-64
Demographics Similar to Nigerians by In Labor Force | Age 20-64
In terms of in labor force | age 20-64, the demographic groups most similar to Nigerians are Immigrants from Costa Rica (79.7%, a difference of 0.0%), Immigrants from Burma/Myanmar (79.7%, a difference of 0.0%), German (79.7%, a difference of 0.010%), Okinawan (79.6%, a difference of 0.010%), and Immigrants from Cuba (79.7%, a difference of 0.020%).
| Demographics | Rating | Rank | In Labor Force | Age 20-64 |
| Austrians | 67.6 /100 | #158 | Good 79.7% |
| Immigrants | Cuba | 66.7 /100 | #159 | Good 79.7% |
| Moroccans | 66.7 /100 | #160 | Good 79.7% |
| South Africans | 66.2 /100 | #161 | Good 79.7% |
| Germans | 65.2 /100 | #162 | Good 79.7% |
| Immigrants | Costa Rica | 64.6 /100 | #163 | Good 79.7% |
| Immigrants | Burma/Myanmar | 64.4 /100 | #164 | Good 79.7% |
| Nigerians | 64.0 /100 | #165 | Good 79.7% |
| Okinawans | 62.7 /100 | #166 | Good 79.6% |
| Immigrants | Iraq | 62.0 /100 | #167 | Good 79.6% |
| Immigrants | Indonesia | 61.8 /100 | #168 | Good 79.6% |
| Laotians | 58.4 /100 | #169 | Average 79.6% |
| Slavs | 54.0 /100 | #170 | Average 79.6% |
| Immigrants | Switzerland | 53.3 /100 | #171 | Average 79.6% |
| Immigrants | Belgium | 53.1 /100 | #172 | Average 79.6% |
Demographics Similar to West Indians by In Labor Force | Age 20-64
In terms of in labor force | age 20-64, the demographic groups most similar to West Indians are U.S. Virgin Islander (78.4%, a difference of 0.020%), Bahamian (78.4%, a difference of 0.040%), British West Indian (78.4%, a difference of 0.050%), Immigrants from Barbados (78.3%, a difference of 0.050%), and Scotch-Irish (78.3%, a difference of 0.080%).
| Demographics | Rating | Rank | In Labor Force | Age 20-64 |
| Whites/Caucasians | 0.2 /100 | #261 | Tragic 78.5% |
| Fijians | 0.1 /100 | #262 | Tragic 78.4% |
| Pennsylvania Germans | 0.1 /100 | #263 | Tragic 78.4% |
| Spaniards | 0.1 /100 | #264 | Tragic 78.4% |
| British West Indians | 0.1 /100 | #265 | Tragic 78.4% |
| Bahamians | 0.1 /100 | #266 | Tragic 78.4% |
| U.S. Virgin Islanders | 0.1 /100 | #267 | Tragic 78.4% |
| West Indians | 0.0 /100 | #268 | Tragic 78.3% |
| Immigrants | Barbados | 0.0 /100 | #269 | Tragic 78.3% |
| Scotch-Irish | 0.0 /100 | #270 | Tragic 78.3% |
| Immigrants | Latin America | 0.0 /100 | #271 | Tragic 78.3% |
| Marshallese | 0.0 /100 | #272 | Tragic 78.3% |
| French American Indians | 0.0 /100 | #273 | Tragic 78.2% |
| Aleuts | 0.0 /100 | #274 | Tragic 78.2% |
| Spanish | 0.0 /100 | #275 | Tragic 78.2% |