Nigerian vs Immigrants from Japan Unemployment Among Women with Children Under 6 years
COMPARE
Nigerian
Immigrants from Japan
Unemployment Among Women with Children Under 6 years
Unemployment Among Women with Children Under 6 years Comparison
Nigerians
Immigrants from Japan
8.2%
UNEMPLOYMENT AMONG WOMEN WITH CHILDREN UNDER 6 YEARS
1.1/ 100
METRIC RATING
250th/ 347
METRIC RANK
6.5%
UNEMPLOYMENT AMONG WOMEN WITH CHILDREN UNDER 6 YEARS
100.0/ 100
METRIC RATING
27th/ 347
METRIC RANK
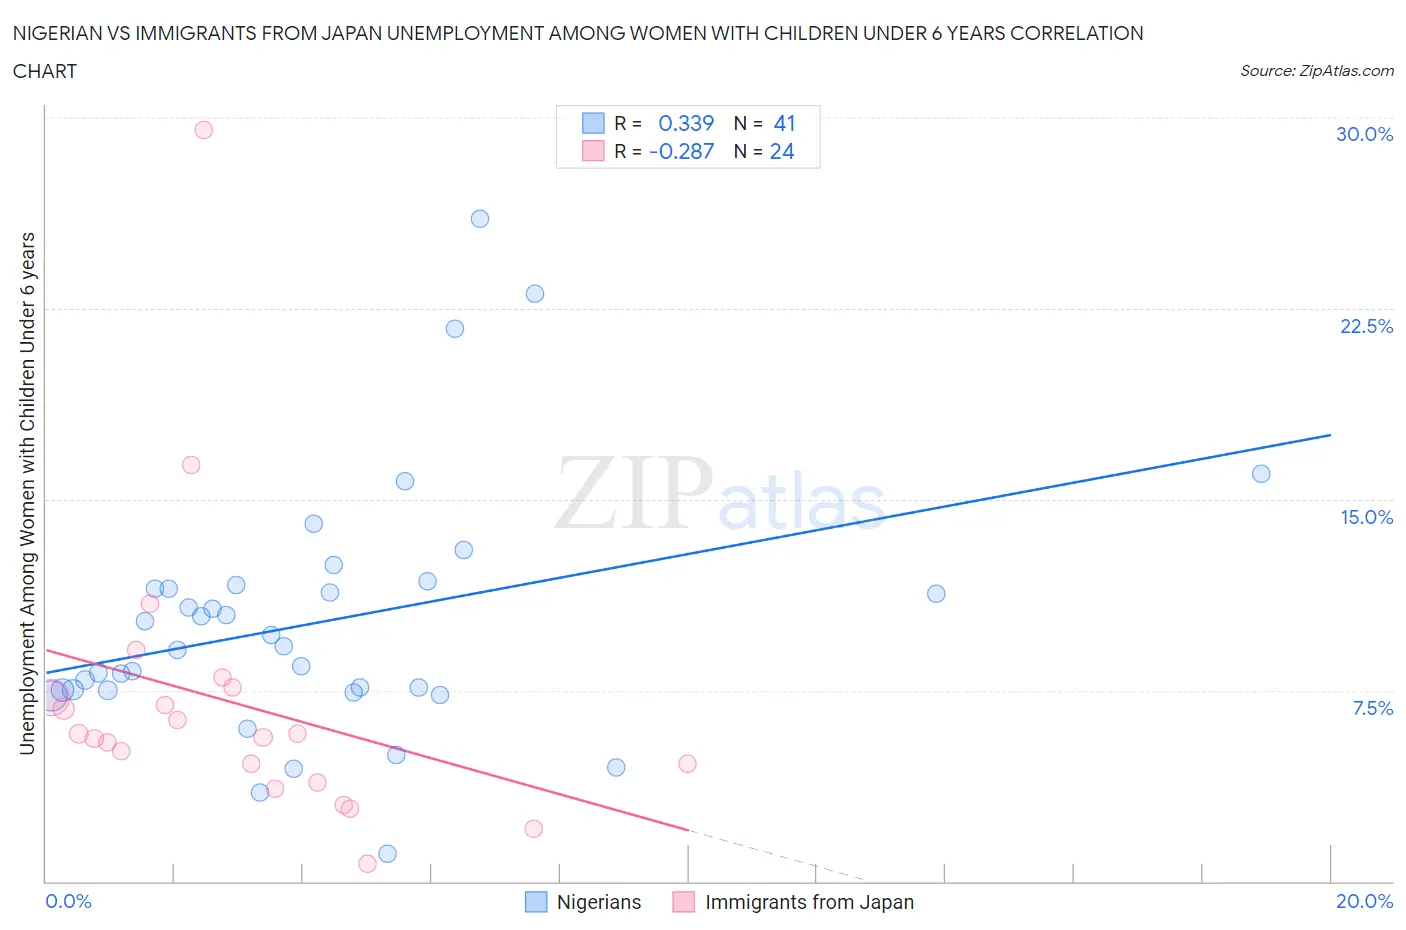
Nigerian vs Immigrants from Japan Unemployment Among Women with Children Under 6 years Correlation Chart
The statistical analysis conducted on geographies consisting of 269,613,333 people shows a mild positive correlation between the proportion of Nigerians and unemployment rate among women with children under the age of 6 in the United States with a correlation coefficient (R) of 0.339 and weighted average of 8.2%. Similarly, the statistical analysis conducted on geographies consisting of 268,694,372 people shows a weak negative correlation between the proportion of Immigrants from Japan and unemployment rate among women with children under the age of 6 in the United States with a correlation coefficient (R) of -0.287 and weighted average of 6.5%, a difference of 25.6%.
Unemployment Among Women with Children Under 6 years Correlation Summary
| Measurement | Nigerian | Immigrants from Japan |
| Minimum | 1.1% | 0.70% |
| Maximum | 26.0% | 29.5% |
| Range | 24.9% | 28.8% |
| Mean | 10.2% | 7.0% |
| Median | 9.2% | 5.7% |
| Interquartile 25% (IQ1) | 7.5% | 4.3% |
| Interquartile 75% (IQ3) | 11.6% | 7.4% |
| Interquartile Range (IQR) | 4.1% | 3.2% |
| Standard Deviation (Sample) | 4.9% | 5.7% |
| Standard Deviation (Population) | 4.9% | 5.6% |
Similar Demographics by Unemployment Among Women with Children Under 6 years
Demographics Similar to Nigerians by Unemployment Among Women with Children Under 6 years
In terms of unemployment among women with children under 6 years, the demographic groups most similar to Nigerians are Immigrants from Sierra Leone (8.2%, a difference of 0.010%), Immigrants from Western Africa (8.2%, a difference of 0.10%), German Russian (8.2%, a difference of 0.14%), Guyanese (8.2%, a difference of 0.17%), and Ghanaian (8.2%, a difference of 0.17%).
| Demographics | Rating | Rank | Unemployment Among Women with Children Under 6 years |
| Hawaiians | 1.8 /100 | #243 | Tragic 8.2% |
| French | 1.7 /100 | #244 | Tragic 8.2% |
| Native Hawaiians | 1.7 /100 | #245 | Tragic 8.2% |
| Central Americans | 1.4 /100 | #246 | Tragic 8.2% |
| German Russians | 1.2 /100 | #247 | Tragic 8.2% |
| Immigrants | Western Africa | 1.1 /100 | #248 | Tragic 8.2% |
| Immigrants | Sierra Leone | 1.1 /100 | #249 | Tragic 8.2% |
| Nigerians | 1.1 /100 | #250 | Tragic 8.2% |
| Guyanese | 1.0 /100 | #251 | Tragic 8.2% |
| Ghanaians | 1.0 /100 | #252 | Tragic 8.2% |
| Immigrants | Guyana | 0.8 /100 | #253 | Tragic 8.2% |
| Immigrants | Caribbean | 0.7 /100 | #254 | Tragic 8.3% |
| Immigrants | Portugal | 0.6 /100 | #255 | Tragic 8.3% |
| Celtics | 0.6 /100 | #256 | Tragic 8.3% |
| British West Indians | 0.5 /100 | #257 | Tragic 8.3% |
Demographics Similar to Immigrants from Japan by Unemployment Among Women with Children Under 6 years
In terms of unemployment among women with children under 6 years, the demographic groups most similar to Immigrants from Japan are Immigrants from Israel (6.5%, a difference of 0.020%), Cypriot (6.5%, a difference of 0.10%), Soviet Union (6.5%, a difference of 0.18%), Laotian (6.5%, a difference of 0.20%), and Immigrants from Sweden (6.6%, a difference of 0.28%).
| Demographics | Rating | Rank | Unemployment Among Women with Children Under 6 years |
| Ute | 100.0 /100 | #20 | Exceptional 6.5% |
| Burmese | 100.0 /100 | #21 | Exceptional 6.5% |
| Immigrants | Korea | 100.0 /100 | #22 | Exceptional 6.5% |
| Bulgarians | 100.0 /100 | #23 | Exceptional 6.5% |
| Laotians | 100.0 /100 | #24 | Exceptional 6.5% |
| Soviet Union | 100.0 /100 | #25 | Exceptional 6.5% |
| Cypriots | 100.0 /100 | #26 | Exceptional 6.5% |
| Immigrants | Japan | 100.0 /100 | #27 | Exceptional 6.5% |
| Immigrants | Israel | 100.0 /100 | #28 | Exceptional 6.5% |
| Immigrants | Sweden | 100.0 /100 | #29 | Exceptional 6.6% |
| Immigrants | Belarus | 100.0 /100 | #30 | Exceptional 6.6% |
| Immigrants | Moldova | 100.0 /100 | #31 | Exceptional 6.6% |
| Tsimshian | 100.0 /100 | #32 | Exceptional 6.6% |
| Immigrants | Vietnam | 100.0 /100 | #33 | Exceptional 6.6% |
| Immigrants | South Central Asia | 100.0 /100 | #34 | Exceptional 6.6% |