Nigerian vs Immigrants from Sudan Unemployment
COMPARE
Nigerian
Immigrants from Sudan
Unemployment
Unemployment Comparison
Nigerians
Immigrants from Sudan
5.8%
UNEMPLOYMENT
0.1/ 100
METRIC RATING
265th/ 347
METRIC RANK
5.0%
UNEMPLOYMENT
96.3/ 100
METRIC RATING
91st/ 347
METRIC RANK
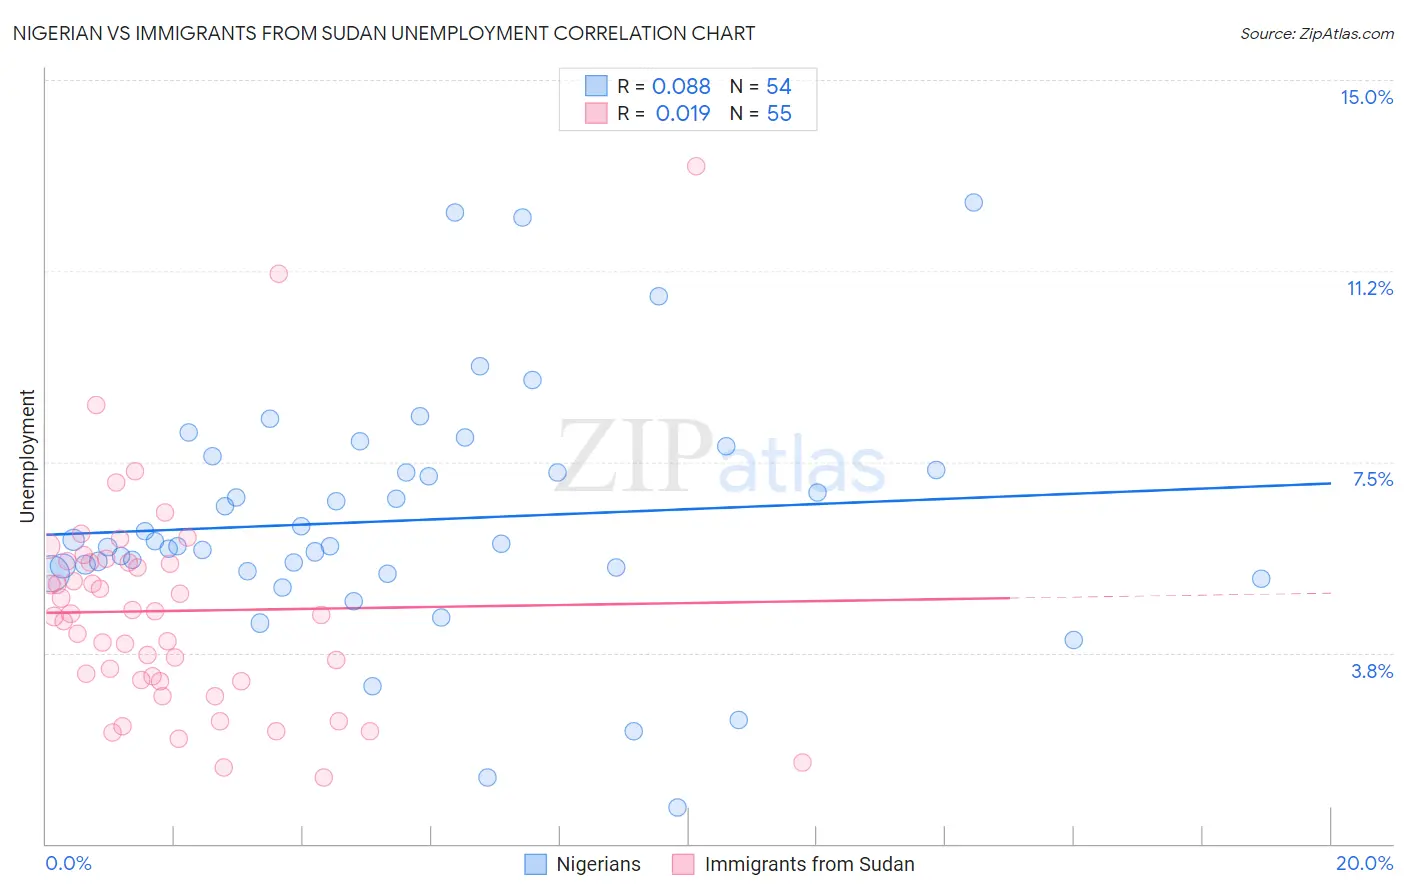
Nigerian vs Immigrants from Sudan Unemployment Correlation Chart
The statistical analysis conducted on geographies consisting of 332,601,343 people shows a slight positive correlation between the proportion of Nigerians and unemployment in the United States with a correlation coefficient (R) of 0.088 and weighted average of 5.8%. Similarly, the statistical analysis conducted on geographies consisting of 118,944,450 people shows no correlation between the proportion of Immigrants from Sudan and unemployment in the United States with a correlation coefficient (R) of 0.019 and weighted average of 5.0%, a difference of 16.3%.
Unemployment Correlation Summary
| Measurement | Nigerian | Immigrants from Sudan |
| Minimum | 0.70% | 1.3% |
| Maximum | 12.6% | 13.3% |
| Range | 11.9% | 12.0% |
| Mean | 6.3% | 4.6% |
| Median | 5.9% | 4.5% |
| Interquartile 25% (IQ1) | 5.4% | 3.2% |
| Interquartile 75% (IQ3) | 7.3% | 5.5% |
| Interquartile Range (IQR) | 2.0% | 2.3% |
| Standard Deviation (Sample) | 2.4% | 2.2% |
| Standard Deviation (Population) | 2.4% | 2.2% |
Similar Demographics by Unemployment
Demographics Similar to Nigerians by Unemployment
In terms of unemployment, the demographic groups most similar to Nigerians are Immigrants from Liberia (5.8%, a difference of 0.070%), Salvadoran (5.8%, a difference of 0.16%), Sierra Leonean (5.8%, a difference of 0.19%), Immigrants from Guatemala (5.8%, a difference of 0.30%), and Immigrants from Uzbekistan (5.8%, a difference of 0.32%).
| Demographics | Rating | Rank | Unemployment |
| Immigrants | Bahamas | 0.1 /100 | #258 | Tragic 5.8% |
| Sub-Saharan Africans | 0.1 /100 | #259 | Tragic 5.8% |
| Immigrants | Uzbekistan | 0.1 /100 | #260 | Tragic 5.8% |
| Immigrants | Guatemala | 0.1 /100 | #261 | Tragic 5.8% |
| Sierra Leoneans | 0.1 /100 | #262 | Tragic 5.8% |
| Salvadorans | 0.1 /100 | #263 | Tragic 5.8% |
| Immigrants | Liberia | 0.1 /100 | #264 | Tragic 5.8% |
| Nigerians | 0.1 /100 | #265 | Tragic 5.8% |
| Mexican American Indians | 0.1 /100 | #266 | Tragic 5.8% |
| Immigrants | Nigeria | 0.1 /100 | #267 | Tragic 5.8% |
| Immigrants | Sierra Leone | 0.1 /100 | #268 | Tragic 5.8% |
| Immigrants | El Salvador | 0.1 /100 | #269 | Tragic 5.8% |
| Blackfeet | 0.1 /100 | #270 | Tragic 5.8% |
| Mexicans | 0.1 /100 | #271 | Tragic 5.9% |
| Hispanics or Latinos | 0.0 /100 | #272 | Tragic 5.9% |
Demographics Similar to Immigrants from Sudan by Unemployment
In terms of unemployment, the demographic groups most similar to Immigrants from Sudan are Immigrants from North Macedonia (5.0%, a difference of 0.010%), Immigrants from South Africa (5.0%, a difference of 0.020%), Jordanian (5.0%, a difference of 0.050%), Ukrainian (5.0%, a difference of 0.11%), and Immigrants from Korea (5.0%, a difference of 0.14%).
| Demographics | Rating | Rank | Unemployment |
| Russians | 97.4 /100 | #84 | Exceptional 5.0% |
| Immigrants | Australia | 97.0 /100 | #85 | Exceptional 5.0% |
| Hungarians | 96.9 /100 | #86 | Exceptional 5.0% |
| Immigrants | Moldova | 96.6 /100 | #87 | Exceptional 5.0% |
| Immigrants | Korea | 96.6 /100 | #88 | Exceptional 5.0% |
| Jordanians | 96.4 /100 | #89 | Exceptional 5.0% |
| Immigrants | North Macedonia | 96.3 /100 | #90 | Exceptional 5.0% |
| Immigrants | Sudan | 96.3 /100 | #91 | Exceptional 5.0% |
| Immigrants | South Africa | 96.2 /100 | #92 | Exceptional 5.0% |
| Ukrainians | 96.0 /100 | #93 | Exceptional 5.0% |
| Immigrants | Austria | 95.9 /100 | #94 | Exceptional 5.0% |
| Immigrants | Serbia | 95.6 /100 | #95 | Exceptional 5.0% |
| Immigrants | England | 95.2 /100 | #96 | Exceptional 5.0% |
| Immigrants | Czechoslovakia | 95.1 /100 | #97 | Exceptional 5.0% |
| Romanians | 95.0 /100 | #98 | Exceptional 5.0% |