Nigerian vs Immigrants from Moldova Female Unemployment
COMPARE
Nigerian
Immigrants from Moldova
Female Unemployment
Female Unemployment Comparison
Nigerians
Immigrants from Moldova
5.8%
FEMALE UNEMPLOYMENT
0.2/ 100
METRIC RATING
260th/ 347
METRIC RANK
4.9%
FEMALE UNEMPLOYMENT
99.0/ 100
METRIC RATING
55th/ 347
METRIC RANK
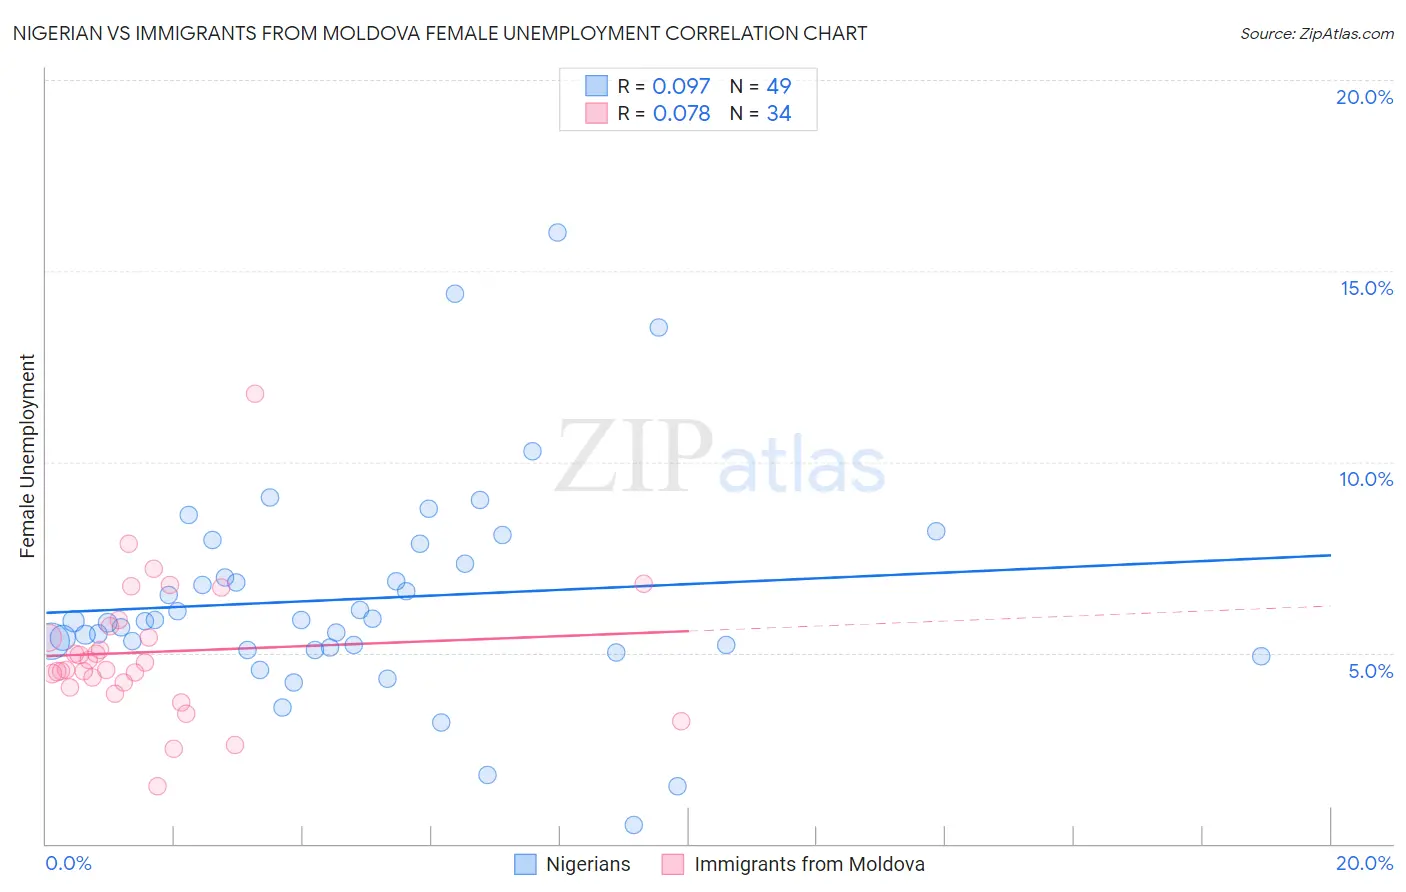
Nigerian vs Immigrants from Moldova Female Unemployment Correlation Chart
The statistical analysis conducted on geographies consisting of 332,062,717 people shows a slight positive correlation between the proportion of Nigerians and unemploymnet rate among females in the United States with a correlation coefficient (R) of 0.097 and weighted average of 5.8%. Similarly, the statistical analysis conducted on geographies consisting of 124,255,765 people shows a slight positive correlation between the proportion of Immigrants from Moldova and unemploymnet rate among females in the United States with a correlation coefficient (R) of 0.078 and weighted average of 4.9%, a difference of 17.7%.
Female Unemployment Correlation Summary
| Measurement | Nigerian | Immigrants from Moldova |
| Minimum | 0.50% | 1.5% |
| Maximum | 16.0% | 11.8% |
| Range | 15.5% | 10.3% |
| Mean | 6.4% | 5.0% |
| Median | 5.8% | 4.7% |
| Interquartile 25% (IQ1) | 5.1% | 4.2% |
| Interquartile 75% (IQ3) | 7.6% | 5.7% |
| Interquartile Range (IQR) | 2.5% | 1.5% |
| Standard Deviation (Sample) | 2.9% | 1.8% |
| Standard Deviation (Population) | 2.8% | 1.8% |
Similar Demographics by Female Unemployment
Demographics Similar to Nigerians by Female Unemployment
In terms of female unemployment, the demographic groups most similar to Nigerians are Immigrants from Fiji (5.8%, a difference of 0.040%), Immigrants from Portugal (5.8%, a difference of 0.14%), Kiowa (5.8%, a difference of 0.26%), Immigrants from Nigeria (5.8%, a difference of 0.30%), and Dutch West Indian (5.7%, a difference of 0.95%).
| Demographics | Rating | Rank | Female Unemployment |
| Immigrants | Sierra Leone | 0.6 /100 | #253 | Tragic 5.7% |
| Immigrants | Immigrants | 0.6 /100 | #254 | Tragic 5.7% |
| Immigrants | Cameroon | 0.6 /100 | #255 | Tragic 5.7% |
| Sub-Saharan Africans | 0.4 /100 | #256 | Tragic 5.7% |
| Dutch West Indians | 0.3 /100 | #257 | Tragic 5.7% |
| Immigrants | Portugal | 0.2 /100 | #258 | Tragic 5.8% |
| Immigrants | Fiji | 0.2 /100 | #259 | Tragic 5.8% |
| Nigerians | 0.2 /100 | #260 | Tragic 5.8% |
| Kiowa | 0.1 /100 | #261 | Tragic 5.8% |
| Immigrants | Nigeria | 0.1 /100 | #262 | Tragic 5.8% |
| Immigrants | Azores | 0.1 /100 | #263 | Tragic 5.8% |
| Immigrants | Bahamas | 0.1 /100 | #264 | Tragic 5.8% |
| Blackfeet | 0.0 /100 | #265 | Tragic 5.9% |
| Cape Verdeans | 0.0 /100 | #266 | Tragic 5.9% |
| Nepalese | 0.0 /100 | #267 | Tragic 5.9% |
Demographics Similar to Immigrants from Moldova by Female Unemployment
In terms of female unemployment, the demographic groups most similar to Immigrants from Moldova are Immigrants from Zimbabwe (4.9%, a difference of 0.020%), Serbian (4.9%, a difference of 0.020%), White/Caucasian (4.9%, a difference of 0.080%), Slavic (4.9%, a difference of 0.10%), and Cambodian (4.9%, a difference of 0.12%).
| Demographics | Rating | Rank | Female Unemployment |
| Thais | 99.2 /100 | #48 | Exceptional 4.9% |
| Australians | 99.2 /100 | #49 | Exceptional 4.9% |
| Immigrants | Cuba | 99.1 /100 | #50 | Exceptional 4.9% |
| Cambodians | 99.1 /100 | #51 | Exceptional 4.9% |
| Slavs | 99.1 /100 | #52 | Exceptional 4.9% |
| Whites/Caucasians | 99.0 /100 | #53 | Exceptional 4.9% |
| Immigrants | Zimbabwe | 99.0 /100 | #54 | Exceptional 4.9% |
| Immigrants | Moldova | 99.0 /100 | #55 | Exceptional 4.9% |
| Serbians | 99.0 /100 | #56 | Exceptional 4.9% |
| Icelanders | 98.8 /100 | #57 | Exceptional 4.9% |
| Immigrants | Lithuania | 98.8 /100 | #58 | Exceptional 4.9% |
| Bhutanese | 98.7 /100 | #59 | Exceptional 4.9% |
| Immigrants | Scotland | 98.6 /100 | #60 | Exceptional 4.9% |
| Immigrants | Canada | 98.6 /100 | #61 | Exceptional 4.9% |
| Immigrants | Nepal | 98.6 /100 | #62 | Exceptional 4.9% |