Ghanaian vs Immigrants from Moldova Female Unemployment
COMPARE
Ghanaian
Immigrants from Moldova
Female Unemployment
Female Unemployment Comparison
Ghanaians
Immigrants from Moldova
5.9%
FEMALE UNEMPLOYMENT
0.0/ 100
METRIC RATING
273rd/ 347
METRIC RANK
4.9%
FEMALE UNEMPLOYMENT
99.0/ 100
METRIC RATING
55th/ 347
METRIC RANK
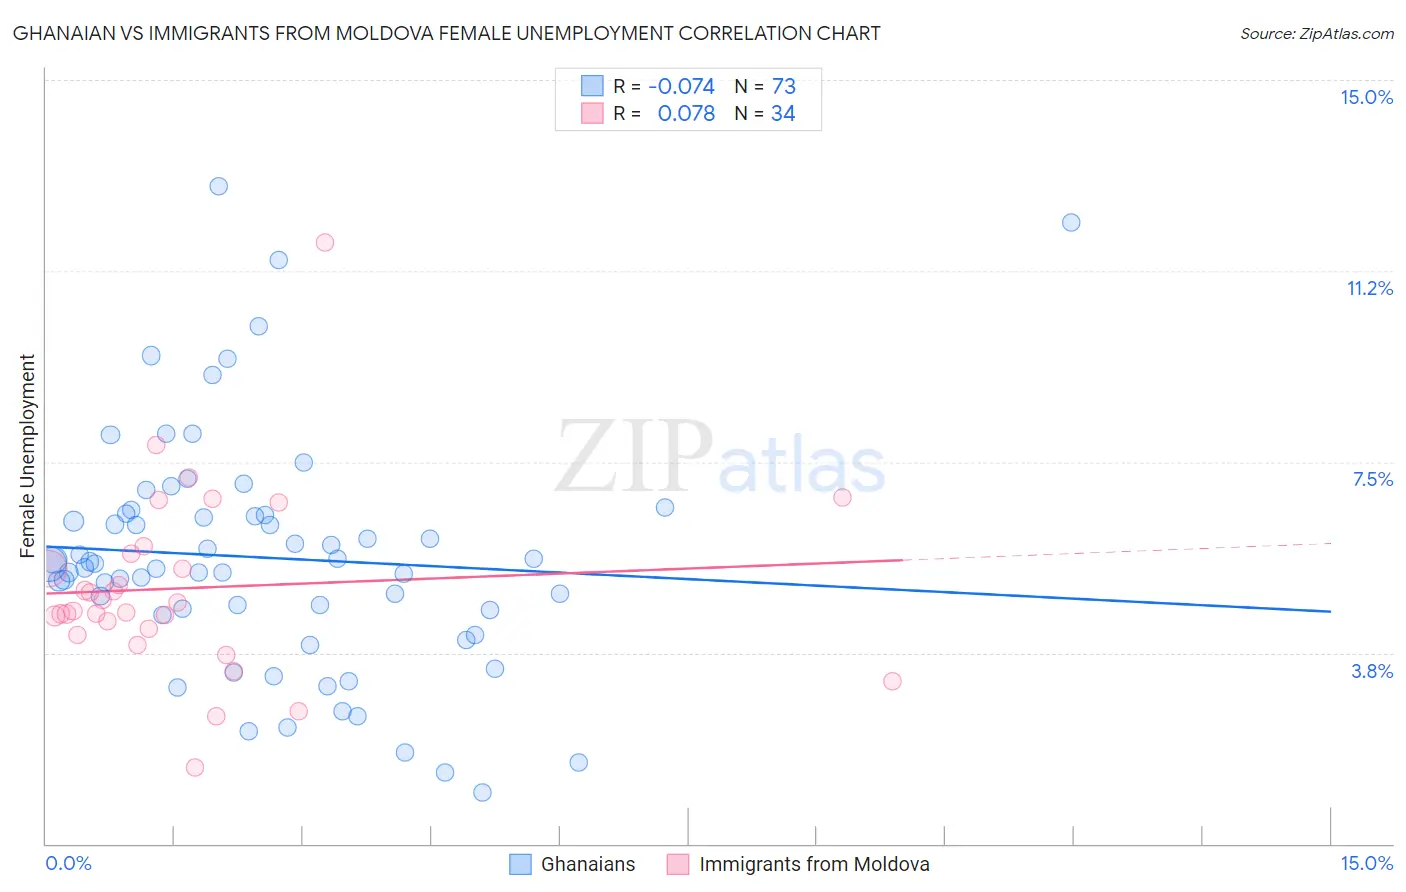
Ghanaian vs Immigrants from Moldova Female Unemployment Correlation Chart
The statistical analysis conducted on geographies consisting of 190,507,316 people shows a slight negative correlation between the proportion of Ghanaians and unemploymnet rate among females in the United States with a correlation coefficient (R) of -0.074 and weighted average of 5.9%. Similarly, the statistical analysis conducted on geographies consisting of 124,255,765 people shows a slight positive correlation between the proportion of Immigrants from Moldova and unemploymnet rate among females in the United States with a correlation coefficient (R) of 0.078 and weighted average of 4.9%, a difference of 21.4%.
Female Unemployment Correlation Summary
| Measurement | Ghanaian | Immigrants from Moldova |
| Minimum | 1.0% | 1.5% |
| Maximum | 12.9% | 11.8% |
| Range | 11.9% | 10.3% |
| Mean | 5.6% | 5.0% |
| Median | 5.5% | 4.7% |
| Interquartile 25% (IQ1) | 4.5% | 4.2% |
| Interquartile 75% (IQ3) | 6.5% | 5.7% |
| Interquartile Range (IQR) | 1.9% | 1.5% |
| Standard Deviation (Sample) | 2.3% | 1.8% |
| Standard Deviation (Population) | 2.3% | 1.8% |
Similar Demographics by Female Unemployment
Demographics Similar to Ghanaians by Female Unemployment
In terms of female unemployment, the demographic groups most similar to Ghanaians are Lumbee (5.9%, a difference of 0.010%), African (5.9%, a difference of 0.080%), Central American (5.9%, a difference of 0.20%), Immigrants from Honduras (5.9%, a difference of 0.30%), and Senegalese (6.0%, a difference of 0.57%).
| Demographics | Rating | Rank | Female Unemployment |
| Cape Verdeans | 0.0 /100 | #266 | Tragic 5.9% |
| Nepalese | 0.0 /100 | #267 | Tragic 5.9% |
| Hondurans | 0.0 /100 | #268 | Tragic 5.9% |
| Immigrants | Western Africa | 0.0 /100 | #269 | Tragic 5.9% |
| Immigrants | Honduras | 0.0 /100 | #270 | Tragic 5.9% |
| Central Americans | 0.0 /100 | #271 | Tragic 5.9% |
| Lumbee | 0.0 /100 | #272 | Tragic 5.9% |
| Ghanaians | 0.0 /100 | #273 | Tragic 5.9% |
| Africans | 0.0 /100 | #274 | Tragic 5.9% |
| Senegalese | 0.0 /100 | #275 | Tragic 6.0% |
| Bahamians | 0.0 /100 | #276 | Tragic 6.0% |
| Immigrants | Ghana | 0.0 /100 | #277 | Tragic 6.0% |
| Yaqui | 0.0 /100 | #278 | Tragic 6.0% |
| Armenians | 0.0 /100 | #279 | Tragic 6.0% |
| Mexican American Indians | 0.0 /100 | #280 | Tragic 6.0% |
Demographics Similar to Immigrants from Moldova by Female Unemployment
In terms of female unemployment, the demographic groups most similar to Immigrants from Moldova are Immigrants from Zimbabwe (4.9%, a difference of 0.020%), Serbian (4.9%, a difference of 0.020%), White/Caucasian (4.9%, a difference of 0.080%), Slavic (4.9%, a difference of 0.10%), and Cambodian (4.9%, a difference of 0.12%).
| Demographics | Rating | Rank | Female Unemployment |
| Thais | 99.2 /100 | #48 | Exceptional 4.9% |
| Australians | 99.2 /100 | #49 | Exceptional 4.9% |
| Immigrants | Cuba | 99.1 /100 | #50 | Exceptional 4.9% |
| Cambodians | 99.1 /100 | #51 | Exceptional 4.9% |
| Slavs | 99.1 /100 | #52 | Exceptional 4.9% |
| Whites/Caucasians | 99.0 /100 | #53 | Exceptional 4.9% |
| Immigrants | Zimbabwe | 99.0 /100 | #54 | Exceptional 4.9% |
| Immigrants | Moldova | 99.0 /100 | #55 | Exceptional 4.9% |
| Serbians | 99.0 /100 | #56 | Exceptional 4.9% |
| Icelanders | 98.8 /100 | #57 | Exceptional 4.9% |
| Immigrants | Lithuania | 98.8 /100 | #58 | Exceptional 4.9% |
| Bhutanese | 98.7 /100 | #59 | Exceptional 4.9% |
| Immigrants | Scotland | 98.6 /100 | #60 | Exceptional 4.9% |
| Immigrants | Canada | 98.6 /100 | #61 | Exceptional 4.9% |
| Immigrants | Nepal | 98.6 /100 | #62 | Exceptional 4.9% |