Nigerian vs Bangladeshi Female Unemployment
COMPARE
Nigerian
Bangladeshi
Female Unemployment
Female Unemployment Comparison
Nigerians
Bangladeshis
5.8%
FEMALE UNEMPLOYMENT
0.2/ 100
METRIC RATING
260th/ 347
METRIC RANK
5.2%
FEMALE UNEMPLOYMENT
64.3/ 100
METRIC RATING
164th/ 347
METRIC RANK
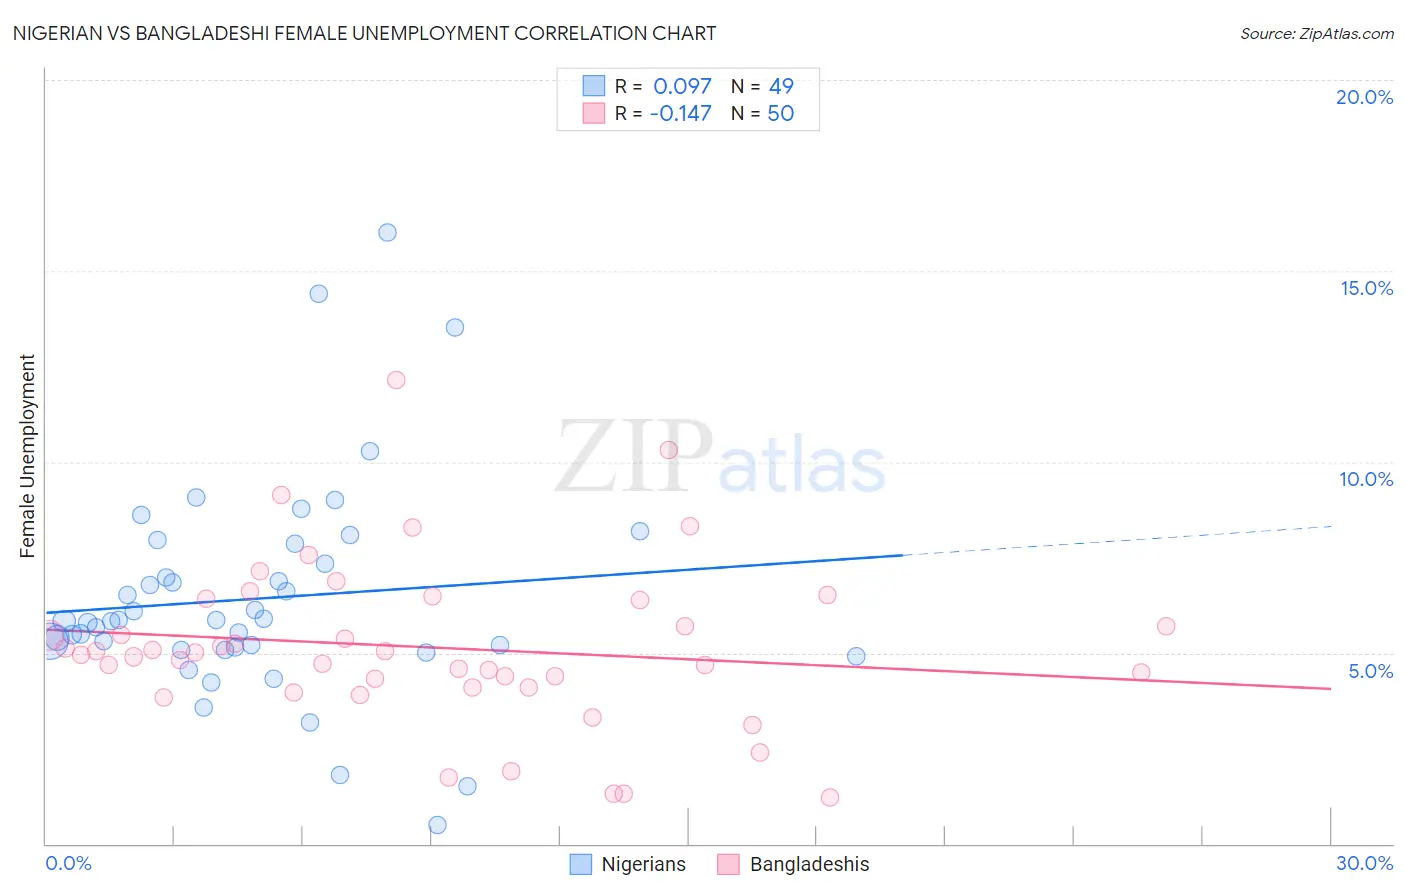
Nigerian vs Bangladeshi Female Unemployment Correlation Chart
The statistical analysis conducted on geographies consisting of 332,062,717 people shows a slight positive correlation between the proportion of Nigerians and unemploymnet rate among females in the United States with a correlation coefficient (R) of 0.097 and weighted average of 5.8%. Similarly, the statistical analysis conducted on geographies consisting of 141,088,133 people shows a poor negative correlation between the proportion of Bangladeshis and unemploymnet rate among females in the United States with a correlation coefficient (R) of -0.147 and weighted average of 5.2%, a difference of 10.5%.
Female Unemployment Correlation Summary
| Measurement | Nigerian | Bangladeshi |
| Minimum | 0.50% | 1.2% |
| Maximum | 16.0% | 12.1% |
| Range | 15.5% | 10.9% |
| Mean | 6.4% | 5.1% |
| Median | 5.8% | 5.0% |
| Interquartile 25% (IQ1) | 5.1% | 4.1% |
| Interquartile 75% (IQ3) | 7.6% | 6.4% |
| Interquartile Range (IQR) | 2.5% | 2.3% |
| Standard Deviation (Sample) | 2.9% | 2.2% |
| Standard Deviation (Population) | 2.8% | 2.1% |
Similar Demographics by Female Unemployment
Demographics Similar to Nigerians by Female Unemployment
In terms of female unemployment, the demographic groups most similar to Nigerians are Immigrants from Fiji (5.8%, a difference of 0.040%), Immigrants from Portugal (5.8%, a difference of 0.14%), Kiowa (5.8%, a difference of 0.26%), Immigrants from Nigeria (5.8%, a difference of 0.30%), and Dutch West Indian (5.7%, a difference of 0.95%).
| Demographics | Rating | Rank | Female Unemployment |
| Immigrants | Sierra Leone | 0.6 /100 | #253 | Tragic 5.7% |
| Immigrants | Immigrants | 0.6 /100 | #254 | Tragic 5.7% |
| Immigrants | Cameroon | 0.6 /100 | #255 | Tragic 5.7% |
| Sub-Saharan Africans | 0.4 /100 | #256 | Tragic 5.7% |
| Dutch West Indians | 0.3 /100 | #257 | Tragic 5.7% |
| Immigrants | Portugal | 0.2 /100 | #258 | Tragic 5.8% |
| Immigrants | Fiji | 0.2 /100 | #259 | Tragic 5.8% |
| Nigerians | 0.2 /100 | #260 | Tragic 5.8% |
| Kiowa | 0.1 /100 | #261 | Tragic 5.8% |
| Immigrants | Nigeria | 0.1 /100 | #262 | Tragic 5.8% |
| Immigrants | Azores | 0.1 /100 | #263 | Tragic 5.8% |
| Immigrants | Bahamas | 0.1 /100 | #264 | Tragic 5.8% |
| Blackfeet | 0.0 /100 | #265 | Tragic 5.9% |
| Cape Verdeans | 0.0 /100 | #266 | Tragic 5.9% |
| Nepalese | 0.0 /100 | #267 | Tragic 5.9% |
Demographics Similar to Bangladeshis by Female Unemployment
In terms of female unemployment, the demographic groups most similar to Bangladeshis are Immigrants from Asia (5.2%, a difference of 0.0%), Syrian (5.2%, a difference of 0.10%), Native Hawaiian (5.2%, a difference of 0.10%), Potawatomi (5.2%, a difference of 0.11%), and Immigrants from Thailand (5.2%, a difference of 0.14%).
| Demographics | Rating | Rank | Female Unemployment |
| Immigrants | Russia | 69.3 /100 | #157 | Good 5.2% |
| Albanians | 68.3 /100 | #158 | Good 5.2% |
| Immigrants | Micronesia | 66.9 /100 | #159 | Good 5.2% |
| Immigrants | Spain | 66.8 /100 | #160 | Good 5.2% |
| Immigrants | Pakistan | 66.7 /100 | #161 | Good 5.2% |
| Potawatomi | 65.9 /100 | #162 | Good 5.2% |
| Immigrants | Asia | 64.3 /100 | #163 | Good 5.2% |
| Bangladeshis | 64.3 /100 | #164 | Good 5.2% |
| Syrians | 62.8 /100 | #165 | Good 5.2% |
| Native Hawaiians | 62.7 /100 | #166 | Good 5.2% |
| Immigrants | Thailand | 62.1 /100 | #167 | Good 5.2% |
| Sri Lankans | 59.4 /100 | #168 | Average 5.2% |
| Immigrants | Chile | 59.0 /100 | #169 | Average 5.2% |
| Spanish | 55.9 /100 | #170 | Average 5.2% |
| Immigrants | Denmark | 55.0 /100 | #171 | Average 5.2% |