Slovene vs Immigrants from Moldova Female Unemployment
COMPARE
Slovene
Immigrants from Moldova
Female Unemployment
Female Unemployment Comparison
Slovenes
Immigrants from Moldova
4.5%
FEMALE UNEMPLOYMENT
100.0/ 100
METRIC RATING
9th/ 347
METRIC RANK
4.9%
FEMALE UNEMPLOYMENT
99.0/ 100
METRIC RATING
55th/ 347
METRIC RANK
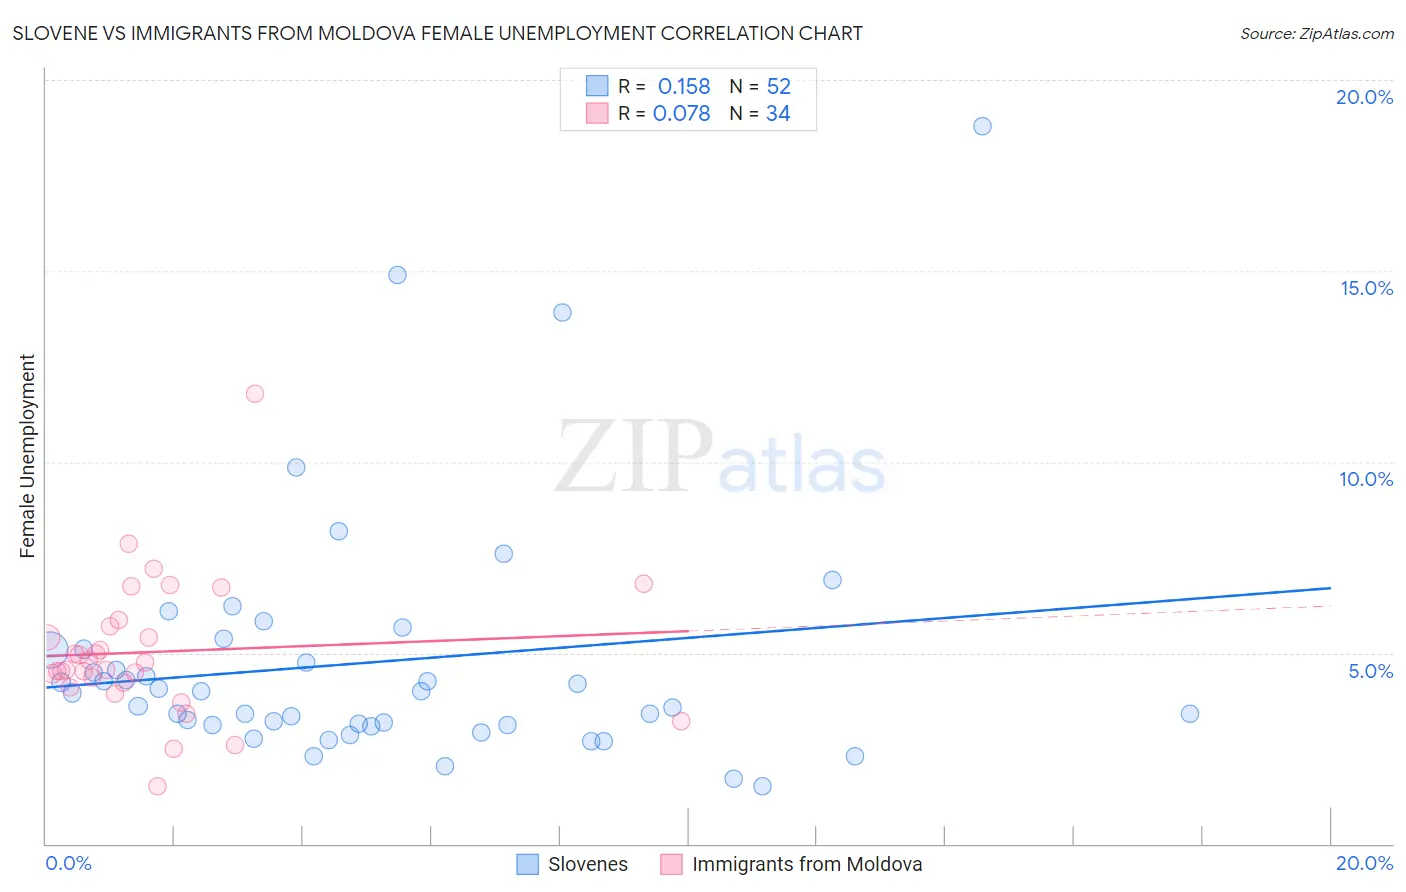
Slovene vs Immigrants from Moldova Female Unemployment Correlation Chart
The statistical analysis conducted on geographies consisting of 260,209,646 people shows a poor positive correlation between the proportion of Slovenes and unemploymnet rate among females in the United States with a correlation coefficient (R) of 0.158 and weighted average of 4.5%. Similarly, the statistical analysis conducted on geographies consisting of 124,255,765 people shows a slight positive correlation between the proportion of Immigrants from Moldova and unemploymnet rate among females in the United States with a correlation coefficient (R) of 0.078 and weighted average of 4.9%, a difference of 8.8%.
Female Unemployment Correlation Summary
| Measurement | Slovene | Immigrants from Moldova |
| Minimum | 1.5% | 1.5% |
| Maximum | 18.8% | 11.8% |
| Range | 17.3% | 10.3% |
| Mean | 4.8% | 5.0% |
| Median | 4.0% | 4.7% |
| Interquartile 25% (IQ1) | 3.1% | 4.2% |
| Interquartile 75% (IQ3) | 5.1% | 5.7% |
| Interquartile Range (IQR) | 2.0% | 1.5% |
| Standard Deviation (Sample) | 3.2% | 1.8% |
| Standard Deviation (Population) | 3.2% | 1.8% |
Similar Demographics by Female Unemployment
Demographics Similar to Slovenes by Female Unemployment
In terms of female unemployment, the demographic groups most similar to Slovenes are German (4.5%, a difference of 0.36%), Chinese (4.5%, a difference of 0.38%), Swedish (4.4%, a difference of 1.1%), Swiss (4.6%, a difference of 1.3%), and Scandinavian (4.6%, a difference of 1.4%).
| Demographics | Rating | Rank | Female Unemployment |
| Czechs | 100.0 /100 | #2 | Exceptional 4.4% |
| Luxembourgers | 100.0 /100 | #3 | Exceptional 4.4% |
| Danes | 100.0 /100 | #4 | Exceptional 4.4% |
| Hmong | 100.0 /100 | #5 | Exceptional 4.4% |
| Swedes | 100.0 /100 | #6 | Exceptional 4.4% |
| Chinese | 100.0 /100 | #7 | Exceptional 4.5% |
| Germans | 100.0 /100 | #8 | Exceptional 4.5% |
| Slovenes | 100.0 /100 | #9 | Exceptional 4.5% |
| Swiss | 100.0 /100 | #10 | Exceptional 4.6% |
| Scandinavians | 100.0 /100 | #11 | Exceptional 4.6% |
| Dutch | 100.0 /100 | #12 | Exceptional 4.6% |
| Belgians | 100.0 /100 | #13 | Exceptional 4.6% |
| Finns | 100.0 /100 | #14 | Exceptional 4.6% |
| English | 100.0 /100 | #15 | Exceptional 4.6% |
| Carpatho Rusyns | 99.9 /100 | #16 | Exceptional 4.7% |
Demographics Similar to Immigrants from Moldova by Female Unemployment
In terms of female unemployment, the demographic groups most similar to Immigrants from Moldova are Immigrants from Zimbabwe (4.9%, a difference of 0.020%), Serbian (4.9%, a difference of 0.020%), White/Caucasian (4.9%, a difference of 0.080%), Slavic (4.9%, a difference of 0.10%), and Cambodian (4.9%, a difference of 0.12%).
| Demographics | Rating | Rank | Female Unemployment |
| Thais | 99.2 /100 | #48 | Exceptional 4.9% |
| Australians | 99.2 /100 | #49 | Exceptional 4.9% |
| Immigrants | Cuba | 99.1 /100 | #50 | Exceptional 4.9% |
| Cambodians | 99.1 /100 | #51 | Exceptional 4.9% |
| Slavs | 99.1 /100 | #52 | Exceptional 4.9% |
| Whites/Caucasians | 99.0 /100 | #53 | Exceptional 4.9% |
| Immigrants | Zimbabwe | 99.0 /100 | #54 | Exceptional 4.9% |
| Immigrants | Moldova | 99.0 /100 | #55 | Exceptional 4.9% |
| Serbians | 99.0 /100 | #56 | Exceptional 4.9% |
| Icelanders | 98.8 /100 | #57 | Exceptional 4.9% |
| Immigrants | Lithuania | 98.8 /100 | #58 | Exceptional 4.9% |
| Bhutanese | 98.7 /100 | #59 | Exceptional 4.9% |
| Immigrants | Scotland | 98.6 /100 | #60 | Exceptional 4.9% |
| Immigrants | Canada | 98.6 /100 | #61 | Exceptional 4.9% |
| Immigrants | Nepal | 98.6 /100 | #62 | Exceptional 4.9% |