New Zealander vs Iranian Female Unemployment
COMPARE
New Zealander
Iranian
Female Unemployment
Female Unemployment Comparison
New Zealanders
Iranians
5.0%
FEMALE UNEMPLOYMENT
97.4/ 100
METRIC RATING
80th/ 347
METRIC RANK
5.3%
FEMALE UNEMPLOYMENT
50.4/ 100
METRIC RATING
173rd/ 347
METRIC RANK
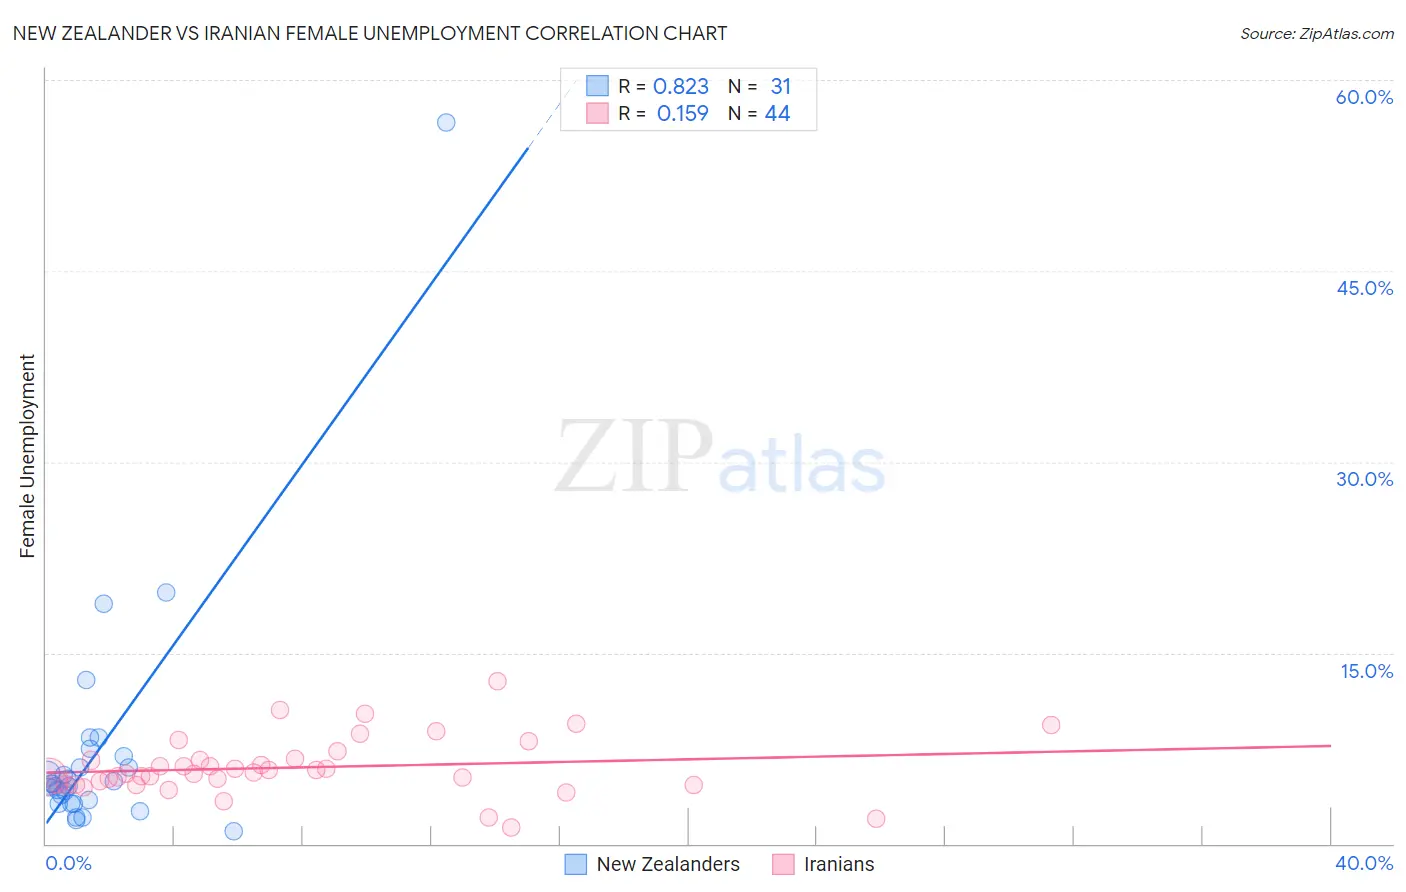
New Zealander vs Iranian Female Unemployment Correlation Chart
The statistical analysis conducted on geographies consisting of 106,766,859 people shows a very strong positive correlation between the proportion of New Zealanders and unemploymnet rate among females in the United States with a correlation coefficient (R) of 0.823 and weighted average of 5.0%. Similarly, the statistical analysis conducted on geographies consisting of 316,106,096 people shows a poor positive correlation between the proportion of Iranians and unemploymnet rate among females in the United States with a correlation coefficient (R) of 0.159 and weighted average of 5.3%, a difference of 5.7%.
Female Unemployment Correlation Summary
| Measurement | New Zealander | Iranian |
| Minimum | 1.0% | 1.3% |
| Maximum | 56.7% | 12.8% |
| Range | 55.7% | 11.5% |
| Mean | 7.4% | 6.0% |
| Median | 4.7% | 5.6% |
| Interquartile 25% (IQ1) | 3.2% | 4.7% |
| Interquartile 75% (IQ3) | 6.9% | 6.6% |
| Interquartile Range (IQR) | 3.7% | 1.9% |
| Standard Deviation (Sample) | 10.1% | 2.3% |
| Standard Deviation (Population) | 9.9% | 2.2% |
Similar Demographics by Female Unemployment
Demographics Similar to New Zealanders by Female Unemployment
In terms of female unemployment, the demographic groups most similar to New Zealanders are Filipino (5.0%, a difference of 0.020%), Immigrants from Australia (5.0%, a difference of 0.070%), Immigrants from Serbia (5.0%, a difference of 0.090%), Turkish (5.0%, a difference of 0.12%), and Canadian (5.0%, a difference of 0.13%).
| Demographics | Rating | Rank | Female Unemployment |
| Russians | 98.0 /100 | #73 | Exceptional 5.0% |
| Immigrants | Bolivia | 98.0 /100 | #74 | Exceptional 5.0% |
| Immigrants | Singapore | 98.0 /100 | #75 | Exceptional 5.0% |
| Immigrants | Venezuela | 97.9 /100 | #76 | Exceptional 5.0% |
| Mongolians | 97.8 /100 | #77 | Exceptional 5.0% |
| Immigrants | Netherlands | 97.8 /100 | #78 | Exceptional 5.0% |
| Turks | 97.6 /100 | #79 | Exceptional 5.0% |
| New Zealanders | 97.4 /100 | #80 | Exceptional 5.0% |
| Filipinos | 97.3 /100 | #81 | Exceptional 5.0% |
| Immigrants | Australia | 97.3 /100 | #82 | Exceptional 5.0% |
| Immigrants | Serbia | 97.2 /100 | #83 | Exceptional 5.0% |
| Canadians | 97.2 /100 | #84 | Exceptional 5.0% |
| Ukrainians | 97.1 /100 | #85 | Exceptional 5.0% |
| Bolivians | 97.1 /100 | #86 | Exceptional 5.0% |
| Venezuelans | 96.9 /100 | #87 | Exceptional 5.0% |
Demographics Similar to Iranians by Female Unemployment
In terms of female unemployment, the demographic groups most similar to Iranians are Immigrants from Uganda (5.3%, a difference of 0.020%), Immigrants from Poland (5.3%, a difference of 0.020%), Immigrants from Laos (5.3%, a difference of 0.17%), Immigrants from Vietnam (5.3%, a difference of 0.18%), and Immigrants from Morocco (5.3%, a difference of 0.18%).
| Demographics | Rating | Rank | Female Unemployment |
| Native Hawaiians | 62.7 /100 | #166 | Good 5.2% |
| Immigrants | Thailand | 62.1 /100 | #167 | Good 5.2% |
| Sri Lankans | 59.4 /100 | #168 | Average 5.2% |
| Immigrants | Chile | 59.0 /100 | #169 | Average 5.2% |
| Spanish | 55.9 /100 | #170 | Average 5.2% |
| Immigrants | Denmark | 55.0 /100 | #171 | Average 5.2% |
| Immigrants | Uganda | 50.7 /100 | #172 | Average 5.3% |
| Iranians | 50.4 /100 | #173 | Average 5.3% |
| Immigrants | Poland | 50.0 /100 | #174 | Average 5.3% |
| Immigrants | Laos | 47.5 /100 | #175 | Average 5.3% |
| Immigrants | Vietnam | 47.5 /100 | #176 | Average 5.3% |
| Immigrants | Morocco | 47.4 /100 | #177 | Average 5.3% |
| Immigrants | Southern Europe | 46.2 /100 | #178 | Average 5.3% |
| Laotians | 45.1 /100 | #179 | Average 5.3% |
| Immigrants | Congo | 43.1 /100 | #180 | Average 5.3% |