New Zealander vs Immigrants from France Unemployment Among Ages 65 to 74 years
COMPARE
New Zealander
Immigrants from France
Unemployment Among Ages 65 to 74 years
Unemployment Among Ages 65 to 74 years Comparison
New Zealanders
Immigrants from France
5.3%
UNEMPLOYMENT AMONG AGES 65 TO 74 YEARS
76.1/ 100
METRIC RATING
143rd/ 347
METRIC RANK
5.3%
UNEMPLOYMENT AMONG AGES 65 TO 74 YEARS
71.0/ 100
METRIC RATING
158th/ 347
METRIC RANK
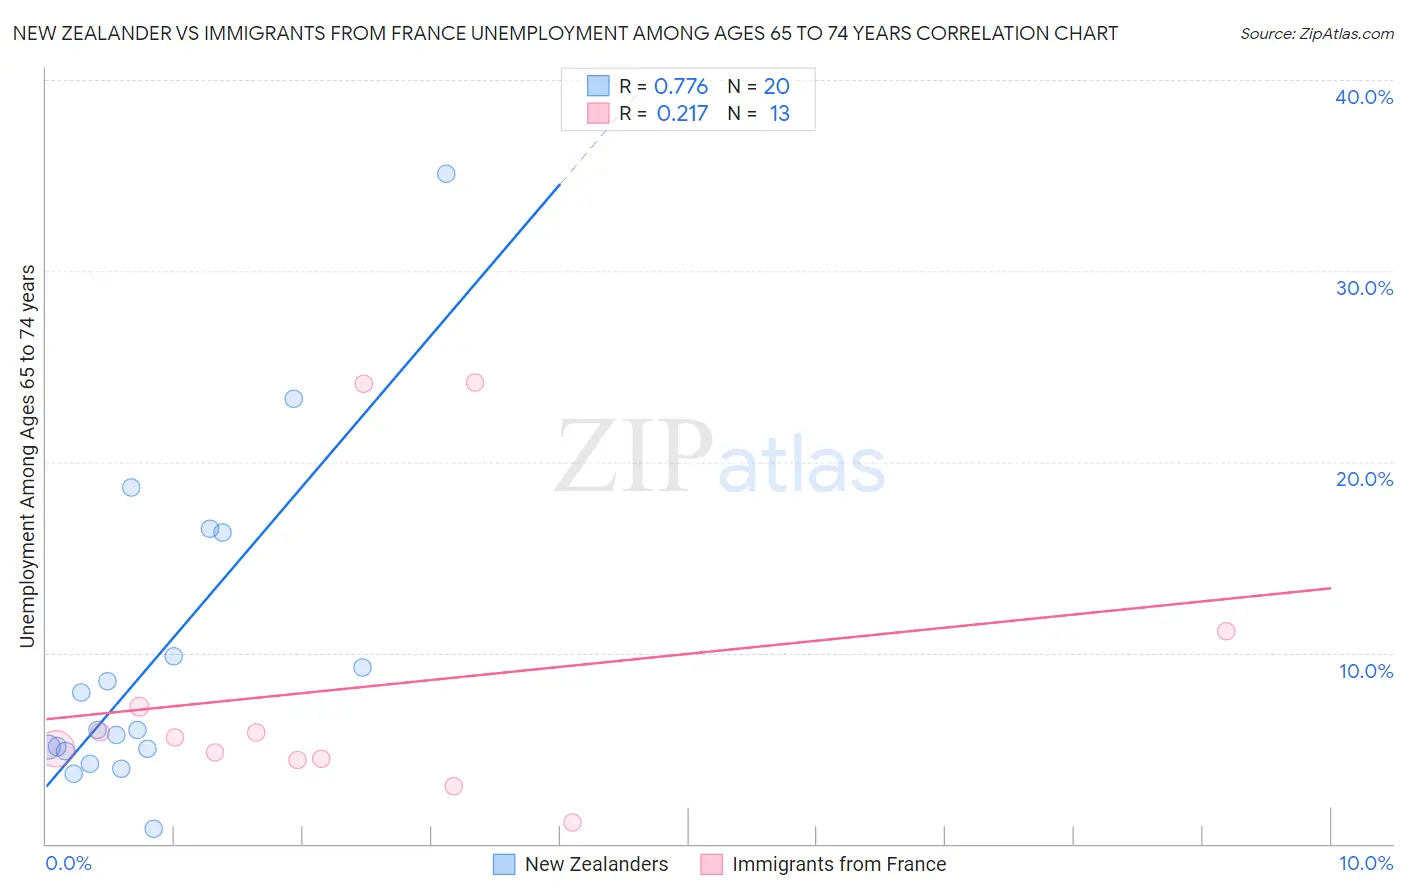
New Zealander vs Immigrants from France Unemployment Among Ages 65 to 74 years Correlation Chart
The statistical analysis conducted on geographies consisting of 102,646,016 people shows a strong positive correlation between the proportion of New Zealanders and unemployment rate among population between the ages 65 and 74 in the United States with a correlation coefficient (R) of 0.776 and weighted average of 5.3%. Similarly, the statistical analysis conducted on geographies consisting of 264,651,909 people shows a weak positive correlation between the proportion of Immigrants from France and unemployment rate among population between the ages 65 and 74 in the United States with a correlation coefficient (R) of 0.217 and weighted average of 5.3%, a difference of 0.22%.
Unemployment Among Ages 65 to 74 years Correlation Summary
| Measurement | New Zealander | Immigrants from France |
| Minimum | 0.82% | 1.1% |
| Maximum | 35.1% | 24.2% |
| Range | 34.3% | 23.1% |
| Mean | 9.8% | 8.2% |
| Median | 6.0% | 5.6% |
| Interquartile 25% (IQ1) | 4.9% | 4.4% |
| Interquartile 75% (IQ3) | 13.1% | 9.1% |
| Interquartile Range (IQR) | 8.1% | 4.7% |
| Standard Deviation (Sample) | 8.3% | 7.4% |
| Standard Deviation (Population) | 8.1% | 7.1% |
Demographics Similar to New Zealanders and Immigrants from France by Unemployment Among Ages 65 to 74 years
In terms of unemployment among ages 65 to 74 years, the demographic groups most similar to New Zealanders are Turkish (5.3%, a difference of 0.0%), Immigrants from Chile (5.3%, a difference of 0.0%), Canadian (5.3%, a difference of 0.050%), Irish (5.3%, a difference of 0.060%), and Immigrants from Latvia (5.3%, a difference of 0.070%). Similarly, the demographic groups most similar to Immigrants from France are Immigrants from Eastern Europe (5.3%, a difference of 0.020%), Immigrants from Cameroon (5.3%, a difference of 0.040%), Dutch (5.3%, a difference of 0.040%), Immigrants from Cabo Verde (5.3%, a difference of 0.060%), and Polish (5.3%, a difference of 0.060%).
| Demographics | Rating | Rank | Unemployment Among Ages 65 to 74 years |
| Immigrants | Laos | 78.6 /100 | #140 | Good 5.3% |
| Immigrants | Asia | 78.4 /100 | #141 | Good 5.3% |
| Turks | 76.2 /100 | #142 | Good 5.3% |
| New Zealanders | 76.1 /100 | #143 | Good 5.3% |
| Immigrants | Chile | 76.0 /100 | #144 | Good 5.3% |
| Canadians | 75.0 /100 | #145 | Good 5.3% |
| Irish | 74.8 /100 | #146 | Good 5.3% |
| Immigrants | Latvia | 74.6 /100 | #147 | Good 5.3% |
| Immigrants | Sri Lanka | 73.8 /100 | #148 | Good 5.3% |
| Immigrants | Romania | 73.5 /100 | #149 | Good 5.3% |
| Immigrants | Poland | 73.2 /100 | #150 | Good 5.3% |
| Immigrants | Indonesia | 72.9 /100 | #151 | Good 5.3% |
| Spanish | 72.6 /100 | #152 | Good 5.3% |
| Immigrants | Cabo Verde | 72.5 /100 | #153 | Good 5.3% |
| Poles | 72.4 /100 | #154 | Good 5.3% |
| Immigrants | Cameroon | 72.1 /100 | #155 | Good 5.3% |
| Dutch | 72.0 /100 | #156 | Good 5.3% |
| Immigrants | Eastern Europe | 71.5 /100 | #157 | Good 5.3% |
| Immigrants | France | 71.0 /100 | #158 | Good 5.3% |
| Immigrants | Czechoslovakia | 66.3 /100 | #159 | Good 5.3% |
| Bangladeshis | 65.8 /100 | #160 | Good 5.3% |