New Zealander vs Fijian Male Unemployment

COMPARE

New Zealander
Race
Ancestry
AfghanAfricanAlaska NativeAlaskan AthabascanAlbanianAleutAlsatianAmericanApacheArabArapahoArgentineanArmenianAssyrian/Chaldean/SyriacAustralianAustrianBahamianBangladeshiBarbadianBasqueBelgianBelizeanBermudanBhutaneseBlackfeetBolivianBrazilianBritishBritish West IndianBulgarianBurmeseCajunCambodianCanadianCape VerdeanCarpatho RusynCelticCentral AmericanCentral American IndianCherokeeCheyenneChickasawChileanChineseChippewaChoctawColombianColvilleComancheCosta RicanCreeCreekCroatianCrowCubanCypriotCzechCzechoslovakianDanishDelawareDominicanDutchDutch West IndianEastern EuropeanEcuadorianEgyptianEnglishEstonianEthiopianEuropeanFilipinoFinnishFrenchFrench American IndianFrench CanadianGermanGerman RussianGhanaianGreekGuamanian/ChamorroGuatemalanGuyaneseHaitianHmongHonduranHopiHoumaHungarianIcelanderIndian (Asian)IndonesianInupiatIranianIraqiIrishIroquoisIsraeliItalianJamaicanJapaneseJordanianKenyanKiowaKoreanLaotianLatvianLebaneseLiberianLithuanianLumbeeLuxembourgerMacedonianMalaysianMalteseMarshalleseMenomineeMexicanMexican American IndianMongolianMoroccanNative HawaiianNavajoNepaleseNew ZealanderNicaraguanNigerianNorthern EuropeanNorwegianOkinawanOsageOttawaPaiutePakistaniPalestinianPanamanianParaguayanPennsylvania GermanPeruvianPimaPolishPortuguesePotawatomiPuebloPuerto RicanPuget Sound SalishRomanianRussianSalvadoranSamoanScandinavianScotch-IrishScottishSeminoleSenegaleseSerbianShoshoneSierra LeoneanSiouxSlavicSlovakSloveneSomaliSouth AfricanSouth AmericanSouth American IndianSoviet UnionSpaniardSpanishSpanish AmericanSpanish American IndianSri LankanSubsaharan AfricanSudaneseSwedishSwissSyrianTaiwaneseThaiTlingit-HaidaTohono O'OdhamTonganTrinidadian and TobagonianTsimshianTurkishU.S. Virgin IslanderUgandanUkrainianUruguayanUteVenezuelanVietnameseWelshWest IndianYakamaYaquiYugoslavianYumanYup'ikZimbabwean
Immigration
NonimmigrantsImmigrantsAfghanistanAfricaAlbaniaArgentinaArmeniaAsiaAustraliaAustriaBahamasBangladeshBarbadosBelarusBelgiumBelizeBoliviaBosnia and HerzegovinaBrazilBulgariaBurma/MyanmarCabo VerdeCambodiaCameroonCanadaCaribbeanCentral AmericaChileChinaColombiaCongoCosta RicaCroatiaCubaCzechoslovakiaDenmarkDominicaDominican RepublicEastern AfricaEastern AsiaEastern EuropeEcuadorEgyptEl SalvadorEnglandEritreaEthiopiaEuropeFijiFranceGermanyGhanaGreeceGrenadaGuatemalaGuyanaHaitiHondurasHong KongHungaryIndiaIndonesiaIranIraqIrelandIsraelItalyJamaicaJapanJordanKazakhstanKenyaKoreaKuwaitLaosLatin AmericaLatviaLebanonLiberiaLithuaniaMalaysiaMexicoMicronesiaMiddle AfricaMoldovaMoroccoNepalNetherlandsNicaraguaNigeriaNorth AmericaNorth MacedoniaNorthern AfricaNorthern EuropeNorwayOceaniaPakistanPanamaPeruPhilippinesPolandPortugalRomaniaRussiaSaudi ArabiaScotlandSenegalSerbiaSierra LeoneSingaporeSomaliaSouth AfricaSouth AmericaSouth Central AsiaSouth Eastern AsiaSouthern EuropeSpainSri LankaSt. Vincent and the GrenadinesSudanSwedenSwitzerlandSyriaTaiwanThailandTrinidad and TobagoTurkeyUgandaUkraineUruguayUzbekistanVenezuelaVietnamWest IndiesWestern AfricaWestern AsiaWestern EuropeYemenZaireZimbabweAzores
Fijian
Race
Ancestry
AfghanAfricanAlaska NativeAlaskan AthabascanAlbanianAleutAlsatianAmericanApacheArabArapahoArgentineanArmenianAssyrian/Chaldean/SyriacAustralianAustrianBahamianBangladeshiBarbadianBasqueBelgianBelizeanBermudanBhutaneseBlackfeetBolivianBrazilianBritishBritish West IndianBulgarianBurmeseCajunCambodianCanadianCape VerdeanCarpatho RusynCelticCentral AmericanCentral American IndianCherokeeCheyenneChickasawChileanChineseChippewaChoctawColombianColvilleComancheCosta RicanCreeCreekCroatianCrowCubanCypriotCzechCzechoslovakianDanishDelawareDominicanDutchDutch West IndianEastern EuropeanEcuadorianEgyptianEnglishEstonianEthiopianEuropeanFijianFilipinoFinnishFrenchFrench American IndianFrench CanadianGermanGerman RussianGhanaianGreekGuamanian/ChamorroGuatemalanGuyaneseHaitianHmongHonduranHopiHoumaHungarianIcelanderIndian (Asian)IndonesianInupiatIranianIraqiIrishIroquoisIsraeliItalianJamaicanJapaneseJordanianKenyanKiowaKoreanLaotianLatvianLebaneseLiberianLithuanianLumbeeLuxembourgerMacedonianMalaysianMalteseMarshalleseMenomineeMexicanMexican American IndianMongolianMoroccanNative HawaiianNavajoNepaleseNicaraguanNigerianNorthern EuropeanNorwegianOkinawanOsageOttawaPaiutePakistaniPalestinianPanamanianParaguayanPennsylvania GermanPeruvianPimaPolishPortuguesePotawatomiPuebloPuerto RicanPuget Sound SalishRomanianRussianSalvadoranSamoanScandinavianScotch-IrishScottishSeminoleSenegaleseSerbianShoshoneSierra LeoneanSiouxSlavicSlovakSloveneSomaliSouth AfricanSouth AmericanSouth American IndianSoviet UnionSpaniardSpanishSpanish AmericanSpanish American IndianSri LankanSubsaharan AfricanSudaneseSwedishSwissSyrianTaiwaneseThaiTlingit-HaidaTohono O'OdhamTonganTrinidadian and TobagonianTsimshianTurkishU.S. Virgin IslanderUgandanUkrainianUruguayanUteVenezuelanVietnameseWelshWest IndianYakamaYaquiYugoslavianYumanYup'ikZimbabwean
Immigration
NonimmigrantsImmigrantsAfghanistanAfricaAlbaniaArgentinaArmeniaAsiaAustraliaAustriaBahamasBangladeshBarbadosBelarusBelgiumBelizeBoliviaBosnia and HerzegovinaBrazilBulgariaBurma/MyanmarCabo VerdeCambodiaCameroonCanadaCaribbeanCentral AmericaChileChinaColombiaCongoCosta RicaCroatiaCubaCzechoslovakiaDenmarkDominicaDominican RepublicEastern AfricaEastern AsiaEastern EuropeEcuadorEgyptEl SalvadorEnglandEritreaEthiopiaEuropeFijiFranceGermanyGhanaGreeceGrenadaGuatemalaGuyanaHaitiHondurasHong KongHungaryIndiaIndonesiaIranIraqIrelandIsraelItalyJamaicaJapanJordanKazakhstanKenyaKoreaKuwaitLaosLatin AmericaLatviaLebanonLiberiaLithuaniaMalaysiaMexicoMicronesiaMiddle AfricaMoldovaMoroccoNepalNetherlandsNicaraguaNigeriaNorth AmericaNorth MacedoniaNorthern AfricaNorthern EuropeNorwayOceaniaPakistanPanamaPeruPhilippinesPolandPortugalRomaniaRussiaSaudi ArabiaScotlandSenegalSerbiaSierra LeoneSingaporeSomaliaSouth AfricaSouth AmericaSouth Central AsiaSouth Eastern AsiaSouthern EuropeSpainSri LankaSt. Vincent and the GrenadinesSudanSwedenSwitzerlandSyriaTaiwanThailandTrinidad and TobagoTurkeyUgandaUkraineUruguayUzbekistanVenezuelaVietnamWest IndiesWestern AfricaWestern AsiaWestern EuropeYemenZaireZimbabweAzores
Male Unemployment
Income
Poverty
Unemployment
Labor Participation
Family Structure
Vehicle Availability
Education Level
Disability

Male Unemployment Comparison

New Zealanders

Fijians

Exceptional
Good
5.0%
MALE UNEMPLOYMENT
97.3/ 100
METRIC RATING
71st/ 347
METRIC RANK
5.2%
MALE UNEMPLOYMENT
78.3/ 100
METRIC RATING
142nd/ 347
METRIC RANK

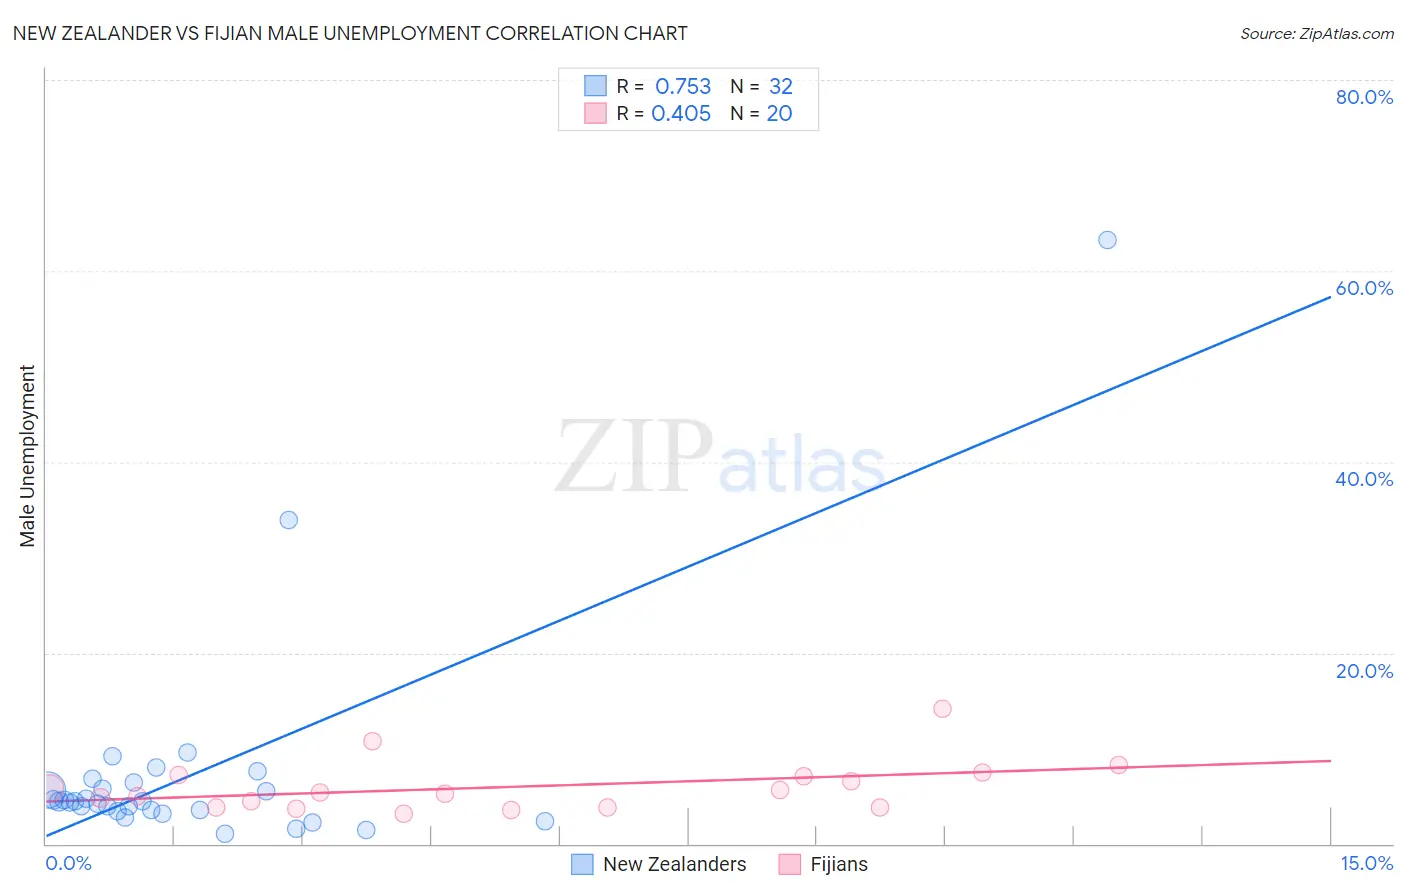
New Zealander vs Fijian Male Unemployment Correlation Chart

The statistical analysis conducted on geographies consisting of 106,769,284 people shows a strong positive correlation between the proportion of New Zealanders and unemployment rate among males in the United States with a correlation coefficient (R) of 0.753 and weighted average of 5.0%. Similarly, the statistical analysis conducted on geographies consisting of 55,914,259 people shows a moderate positive correlation between the proportion of Fijians and unemployment rate among males in the United States with a correlation coefficient (R) of 0.405 and weighted average of 5.2%, a difference of 3.5%.
New Zealander vs Fijian Male Unemployment

Male Unemployment Correlation Summary

MeasurementNew ZealanderFijian
Minimum1.1%3.1%
Maximum63.2%14.2%
Range62.1%11.1%
Mean7.3%6.0%
Median4.4%5.3%
Interquartile 25% (IQ1)3.5%3.8%
Interquartile 75% (IQ3)6.1%7.1%
Interquartile Range (IQR)2.6%3.3%
Standard Deviation (Sample)11.6%2.7%
Standard Deviation (Population)11.4%2.7%

Similar Demographics by Male Unemployment

Demographics Similar to New Zealanders by Male Unemployment

In terms of male unemployment, the demographic groups most similar to New Zealanders are White/Caucasian (5.0%, a difference of 0.020%), Immigrants from Sweden (5.0%, a difference of 0.070%), Immigrants from South Africa (5.0%, a difference of 0.070%), Australian (5.0%, a difference of 0.10%), and Immigrants from Canada (5.0%, a difference of 0.11%).
DemographicsRating | RankMale Unemployment
Celtics
97.8
/100
|
#64
Exceptional
5.0%
Icelanders
97.6
/100
|
#65
Exceptional
5.0%
Finns
97.5
/100
|
#66
Exceptional
5.0%
Immigrants | Canada
97.5
/100
|
#67
Exceptional
5.0%
Australians
97.4
/100
|
#68
Exceptional
5.0%
Immigrants | Sweden
97.4
/100
|
#69
Exceptional
5.0%
Whites/Caucasians
97.3
/100
|
#70
Exceptional
5.0%
New Zealanders
97.3
/100
|
#71
Exceptional
5.0%
Immigrants | South Africa
97.1
/100
|
#72
Exceptional
5.0%
Greeks
97.0
/100
|
#73
Exceptional
5.0%
Immigrants | North America
96.9
/100
|
#74
Exceptional
5.0%
Assyrians/Chaldeans/Syriacs
96.9
/100
|
#75
Exceptional
5.0%
Immigrants | Sudan
96.5
/100
|
#76
Exceptional
5.0%
Iranians
96.4
/100
|
#77
Exceptional
5.0%
Immigrants | Northern Europe
96.4
/100
|
#78
Exceptional
5.0%

Demographics Similar to Fijians by Male Unemployment

In terms of male unemployment, the demographic groups most similar to Fijians are Syrian (5.2%, a difference of 0.030%), Sri Lankan (5.2%, a difference of 0.030%), Macedonian (5.2%, a difference of 0.050%), Immigrants from Kenya (5.2%, a difference of 0.050%), and Immigrants from Burma/Myanmar (5.2%, a difference of 0.070%).
DemographicsRating | RankMale Unemployment
Immigrants | Saudi Arabia
80.1
/100
|
#135
Excellent
5.2%
Lebanese
79.9
/100
|
#136
Good
5.2%
Immigrants | Eastern Africa
79.8
/100
|
#137
Good
5.2%
Immigrants | Croatia
79.7
/100
|
#138
Good
5.2%
Kenyans
79.4
/100
|
#139
Good
5.2%
Brazilians
79.3
/100
|
#140
Good
5.2%
Immigrants | Switzerland
79.2
/100
|
#141
Good
5.2%
Fijians
78.3
/100
|
#142
Good
5.2%
Syrians
78.0
/100
|
#143
Good
5.2%
Sri Lankans
77.9
/100
|
#144
Good
5.2%
Macedonians
77.7
/100
|
#145
Good
5.2%
Immigrants | Kenya
77.6
/100
|
#146
Good
5.2%
Immigrants | Burma/Myanmar
77.5
/100
|
#147
Good
5.2%
Immigrants | Italy
76.3
/100
|
#148
Good
5.2%
Immigrants | Europe
76.2
/100
|
#149
Good
5.2%