Navajo vs Immigrants from Israel Male Unemployment
COMPARE
Navajo
Immigrants from Israel
Male Unemployment
Male Unemployment Comparison
Navajo
Immigrants from Israel
9.8%
MALE UNEMPLOYMENT
0.0/ 100
METRIC RATING
341st/ 347
METRIC RANK
5.4%
MALE UNEMPLOYMENT
25.2/ 100
METRIC RATING
193rd/ 347
METRIC RANK
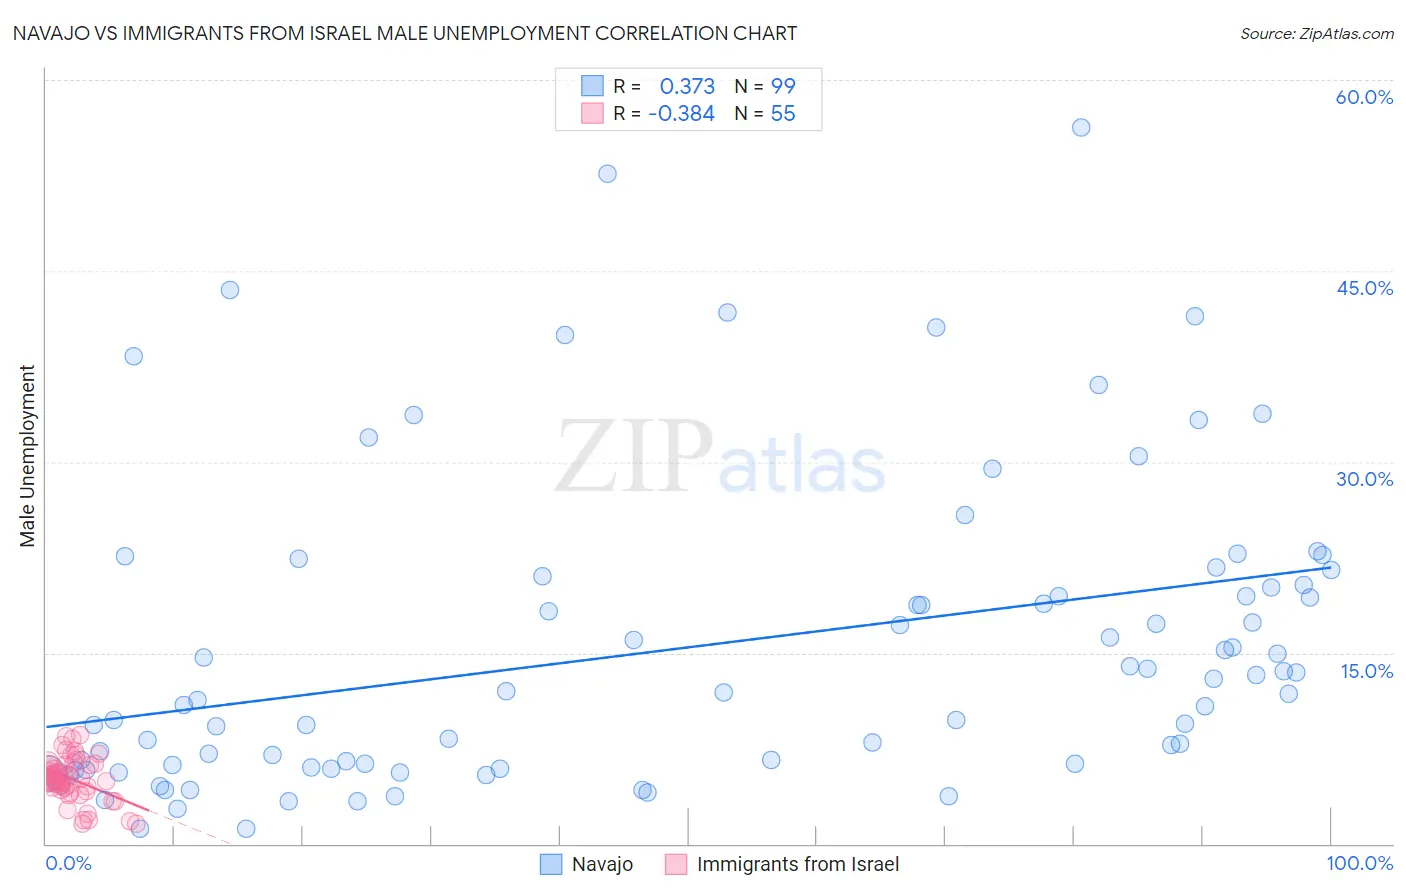
Navajo vs Immigrants from Israel Male Unemployment Correlation Chart
The statistical analysis conducted on geographies consisting of 223,979,709 people shows a mild positive correlation between the proportion of Navajo and unemployment rate among males in the United States with a correlation coefficient (R) of 0.373 and weighted average of 9.8%. Similarly, the statistical analysis conducted on geographies consisting of 209,695,257 people shows a mild negative correlation between the proportion of Immigrants from Israel and unemployment rate among males in the United States with a correlation coefficient (R) of -0.384 and weighted average of 5.4%, a difference of 82.8%.
Male Unemployment Correlation Summary
| Measurement | Navajo | Immigrants from Israel |
| Minimum | 1.2% | 1.6% |
| Maximum | 56.3% | 8.5% |
| Range | 55.1% | 6.9% |
| Mean | 15.4% | 5.1% |
| Median | 11.9% | 5.1% |
| Interquartile 25% (IQ1) | 6.0% | 4.3% |
| Interquartile 75% (IQ3) | 20.4% | 6.2% |
| Interquartile Range (IQR) | 14.4% | 2.0% |
| Standard Deviation (Sample) | 12.0% | 1.7% |
| Standard Deviation (Population) | 11.9% | 1.7% |
Similar Demographics by Male Unemployment
Demographics Similar to Navajo by Male Unemployment
In terms of male unemployment, the demographic groups most similar to Navajo are Alaskan Athabascan (9.8%, a difference of 0.28%), Cheyenne (9.8%, a difference of 0.36%), Tohono O'odham (10.2%, a difference of 3.4%), Crow (10.6%, a difference of 7.9%), and Hopi (10.8%, a difference of 9.7%).
| Demographics | Rating | Rank | Male Unemployment |
| Sioux | 0.0 /100 | #333 | Tragic 8.4% |
| Tsimshian | 0.0 /100 | #334 | Tragic 8.5% |
| Pueblo | 0.0 /100 | #335 | Tragic 8.5% |
| Yuman | 0.0 /100 | #336 | Tragic 8.6% |
| Puerto Ricans | 0.0 /100 | #337 | Tragic 8.6% |
| Apache | 0.0 /100 | #338 | Tragic 8.6% |
| Cheyenne | 0.0 /100 | #339 | Tragic 9.8% |
| Alaskan Athabascans | 0.0 /100 | #340 | Tragic 9.8% |
| Navajo | 0.0 /100 | #341 | Tragic 9.8% |
| Tohono O'odham | 0.0 /100 | #342 | Tragic 10.2% |
| Crow | 0.0 /100 | #343 | Tragic 10.6% |
| Hopi | 0.0 /100 | #344 | Tragic 10.8% |
| Arapaho | 0.0 /100 | #345 | Tragic 11.0% |
| Inupiat | 0.0 /100 | #346 | Tragic 12.1% |
| Yup'ik | 0.0 /100 | #347 | Tragic 16.4% |
Demographics Similar to Immigrants from Israel by Male Unemployment
In terms of male unemployment, the demographic groups most similar to Immigrants from Israel are Immigrants from Belarus (5.4%, a difference of 0.060%), Immigrants from South Eastern Asia (5.4%, a difference of 0.22%), Immigrants from Uganda (5.4%, a difference of 0.26%), Immigrants from South America (5.4%, a difference of 0.30%), and Arab (5.4%, a difference of 0.36%).
| Demographics | Rating | Rank | Male Unemployment |
| Iraqis | 31.6 /100 | #186 | Fair 5.4% |
| Costa Ricans | 31.3 /100 | #187 | Fair 5.4% |
| Arabs | 30.2 /100 | #188 | Fair 5.4% |
| Immigrants | South America | 29.4 /100 | #189 | Fair 5.4% |
| Immigrants | Uganda | 28.8 /100 | #190 | Fair 5.4% |
| Immigrants | South Eastern Asia | 28.2 /100 | #191 | Fair 5.4% |
| Immigrants | Belarus | 26.0 /100 | #192 | Fair 5.4% |
| Immigrants | Israel | 25.2 /100 | #193 | Fair 5.4% |
| Spanish | 19.7 /100 | #194 | Poor 5.4% |
| Immigrants | Southern Europe | 17.7 /100 | #195 | Poor 5.4% |
| Albanians | 17.3 /100 | #196 | Poor 5.4% |
| Alsatians | 16.7 /100 | #197 | Poor 5.4% |
| Immigrants | Thailand | 14.7 /100 | #198 | Poor 5.4% |
| Immigrants | Greece | 14.5 /100 | #199 | Poor 5.4% |
| Immigrants | Zaire | 13.7 /100 | #200 | Poor 5.4% |